- What remote sensing means, and the three things every act of remote sensing involves
- The eight stages that carry energy from its source to a finished map or table
- The electromagnetic spectrum, and which three regions of it are actually used in remote sensing
- How sensors are classified, and the difference between Sun-Synchronous and Geostationary satellites
- How Whiskbroom and Pushbroom scanners build up a digital image
- Four different meanings of “resolution”: temporal, spatial, spectral and radiometric
- The difference between an image and a photograph, and between photographic and digital data products
- The seven elements used to visually interpret a satellite image: tone, texture, size, shape, shadow, pattern and association
1What is Remote Sensing?
Your own eyes, and an ordinary camera, both work the same basic way: they respond to light, but only to a very small slice of all the energy that objects around you give off. Modern remote sensing devices go far beyond that narrow slice. They can react to a much wider range of radiation, reflected, emitted, absorbed or transmitted, by every object with a temperature above 0 Kelvin (-273°C), which, in practice, means every object on Earth.
The term “remote sensing” was first used in the early 1960s.
Remote Sensing is the total process used to acquire and measure information about some property of an object or phenomenon, using a recording device (a sensor) that is not in physical contact with the object or phenomenon under study.
Notice what this definition is really saying: it names three things that are always present in any act of remote sensing: the object surface, the recording device (sensor), and the information-carrying energy waves that travel between them.
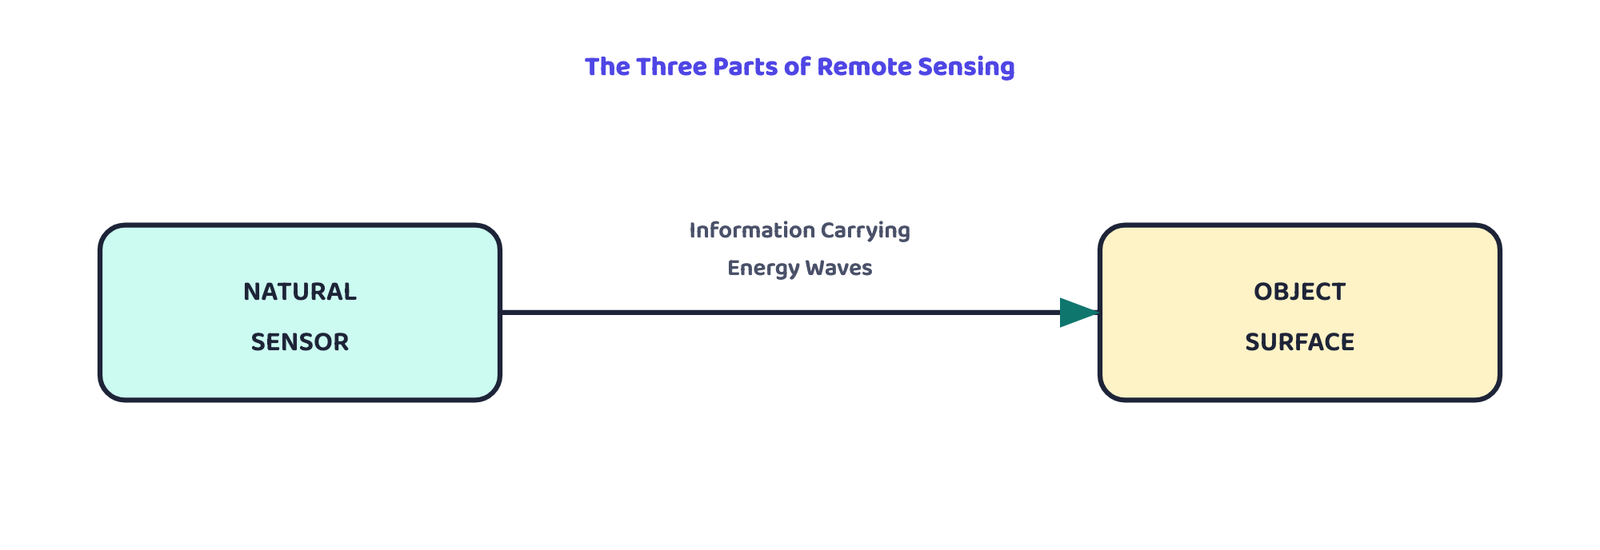
“No physical contact” is the one phrase examiners look for in a one-mark definition question. If your answer does not mention that the sensor is not in contact with the object, it is incomplete.
2Stages in Remote Sensing
Every act of remote sensing, from a weather satellite photographing clouds to a resource satellite mapping crops, goes through the same eight stages. The book labels them (a) to (h), and long-answer questions often ask you to list them in order.
A fresh, clear water body absorbs most of the energy that reaches it in the red and infrared regions of the spectrum, so it appears dark or black in a satellite image. A turbid (muddy) water body, on the other hand, reflects more energy in the blue and green regions, so it appears in a lighter tone. Same stage of the process, two different objects, two different results. This is exactly what stage (c) means by “interaction depends on the object”.
3Electromagnetic Radiation and the Spectrum
Electromagnetic Radiation (EMR) is energy that propagates through space or a medium at the speed of light. Its waves vary in wavelength and frequency, and plotting that variation gives the Electromagnetic Spectrum.
The Electromagnetic Spectrum is the continuous range of EMR, running from short-wavelength, high-frequency cosmic and gamma radiation at one end to long-wavelength, low-frequency radio waves at the other.
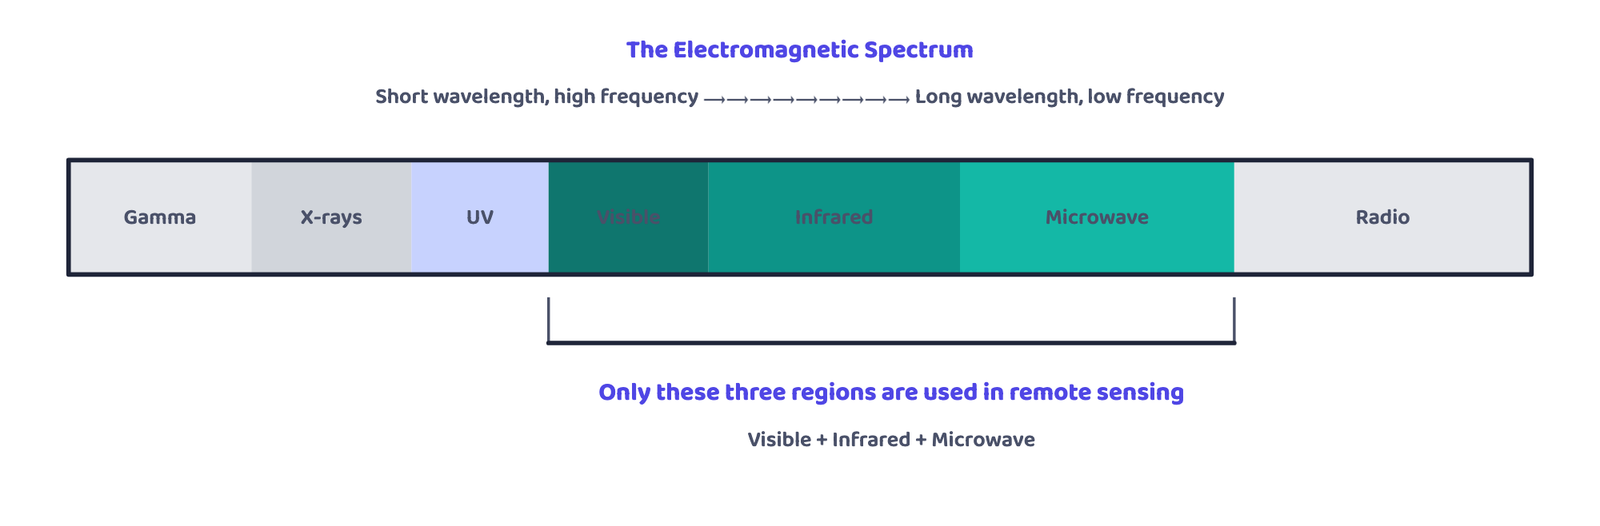
Students often assume every region of the EMR spectrum is used in remote sensing. The book is explicit that only three regions are actually used: Visible, Infrared and Microwave. Gamma rays, X-rays, Ultraviolet and Radio waves are part of the spectrum but are not the ones used in satellite remote sensing.
4Sensors, Platforms and Satellites
A Sensor is a device that gathers electromagnetic radiation, converts it into a signal, and presents it in a form suitable for obtaining information about the object under investigation.
Based on the form of the data they output, sensors are classified into two kinds.
Photographic (Analogue) Sensors
- A camera: records the image of objects at one instant of exposure
- Output is a photograph, on film
- Not used in modern satellite remote sensing, which this chapter focuses on
Non-Photographic (Digital) Sensors
- Called scanners: obtain the image bit by bit, one small piece at a time
- Output is a digital image made of numbers
- These are the sensors used in satellite remote sensing, and the ones this chapter describes
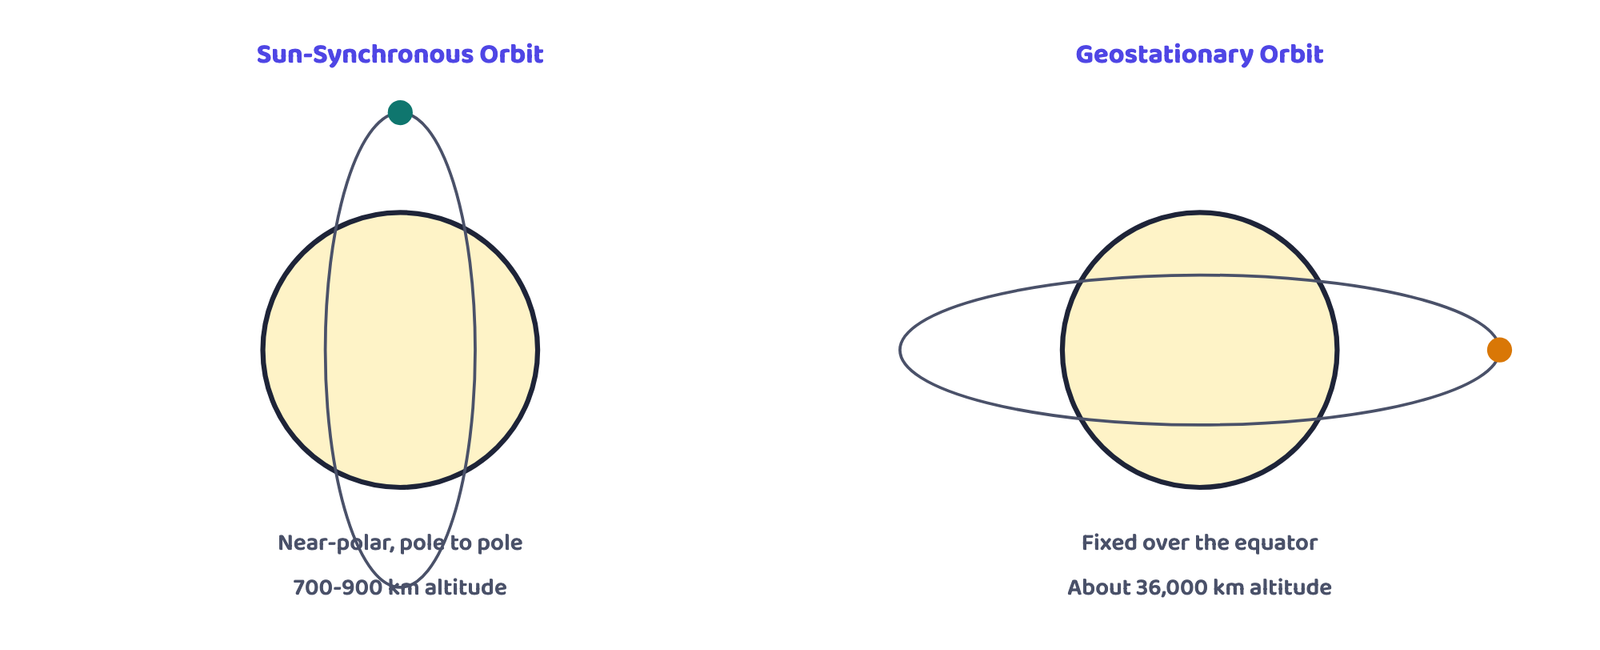
The sensors used in remote sensing satellites are placed on one of two very different kinds of orbiting platform.
| Orbital Characteristic | Sun-Synchronous Satellites | Geostationary Satellites |
|---|---|---|
| Altitude | 700-900 km | About 36,000 km |
| Coverage | 81°N to 81°S | 1/3rd of the globe |
| Orbital period | About 14 orbits per day | 24 hours |
| Resolution | Fine (182 metre to 1 metre) | Coarse (1 km × 1 km) |
| Uses | Earth Resources Applications | Telecommunication and Weather monitoring |
| Named example | Indian Remote Sensing (IRS) series | INSAT series |
India’s own earth receiving station for remote sensing data is located at Shadnagar, near Hyderabad. Data collected by a satellite anywhere over the globe is electronically transmitted down to stations like this one.
5Multispectral Scanners
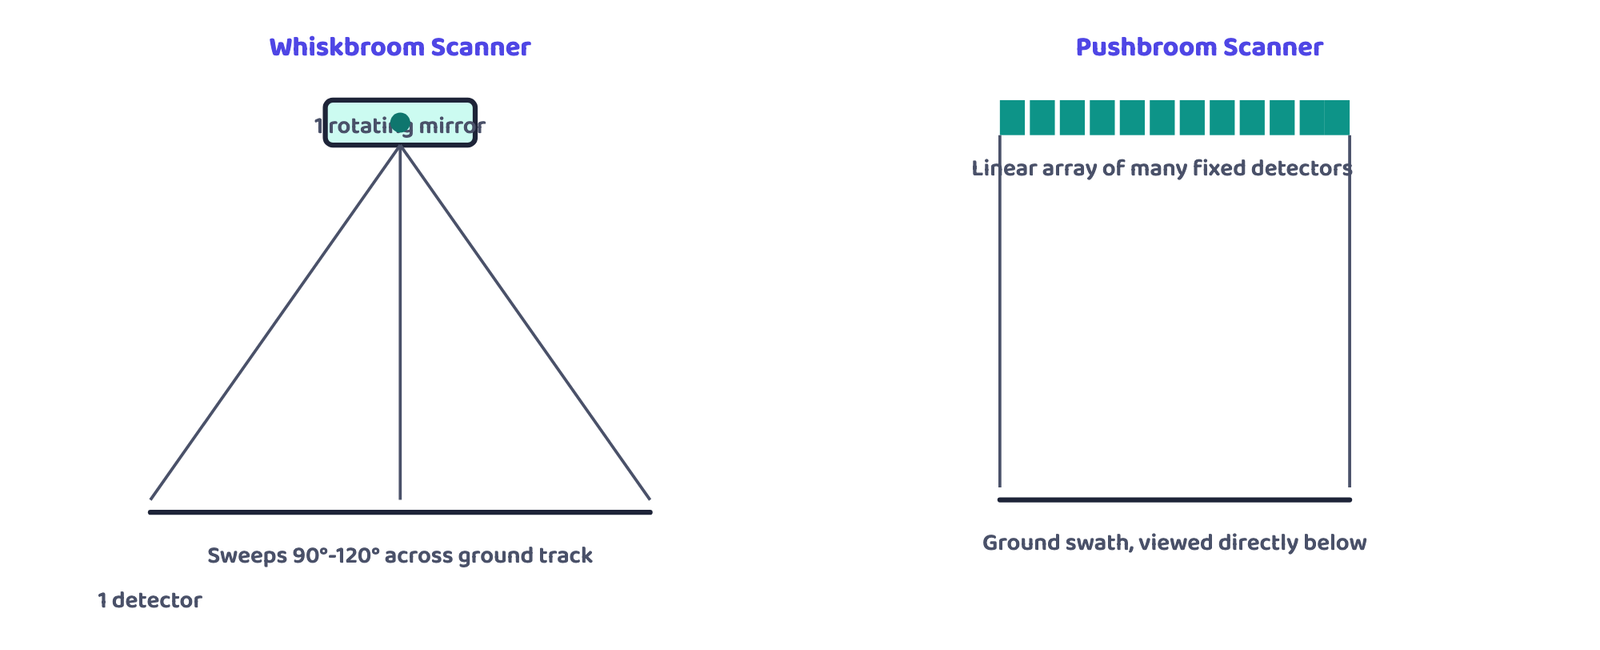
Since the sensors used in satellite remote sensing are scanners, it helps to know how a scanner actually builds its image. A scanner has a reception system made of a mirror and detectors. As the mirror oscillates, the sensor records a series of scan lines, one strip of the ground at a time, which is why the method is called “bit-by-bit” image collection. The angular field of view that the mirror sweeps through determines the length of each scan line, called the swath. The signals the detectors pick up are converted into numerical values called Digital Numbers (DN).
Multispectral scanners are divided into two types.
Q. The French satellite SPOT’s HRV-1 sensor has a swath of 60 km and a spatial resolution of 20 metres. How many detectors does it use?
Step 1: Convert the swath to metres: 60 km = 60,000 m.
Step 2: Divide the swath by the spatial resolution: 60,000 ÷ 20 = 3,000 detectors.
Why this works: in a pushbroom scanner, each detector in the linear array covers exactly one ground cell (pixel) at nadir, so the number of detectors always equals swath ÷ resolution.
Remember the two field-of-view terms that go with the whiskbroom scanner: the Total Field of View (TFOV) is the full angular extent the oscillating sensor can reach, while the Instantaneous Field of View (IFOV) is the small, fixed angular patch the sensor’s optical head is looking at at any one moment.
6Resolving Powers of Satellites
6.1 Temporal Resolution
Temporal Resolution (also called the revisit time) is the pre-determined periodical interval after which a sun-synchronous satellite collects a fresh image of the same area of the earth’s surface.
Temporal resolution is what makes change detection possible. The book gives two of its own examples of this in action, described here in words rather than as images:
| Example | What temporal resolution revealed |
|---|---|
| Himalayas, imaged in May and again in November | Vegetation type changes visibly between the two dates: coniferous cover shows as red patches in May; additional red patches (deciduous cover) and a light red tone (crops) appear by November |
| Banda Aceh, Indonesia, imaged before and after the December 2004 Indian Ocean tsunami | The June 2004 (pre-tsunami) image shows the area’s undisturbed topography; the image taken immediately after the tsunami reveals the damage it caused |
6.2 Spatial, Spectral and Radiometric Resolution
Beyond temporal resolution, remote sensors are also characterised by three more kinds of resolution, and exam questions frequently ask you to tell them apart.
Spatial Resolution is the sensor’s capability to distinguish between two closely spaced object surfaces, showing them as two separate objects rather than one blur. As resolution increases, smaller and smaller objects can be identified.
Some people wear spectacles to read, because without them their eyes cannot tell two closely spaced letters apart, so the letters blur into one shape. Positive spectacles improve the eye’s resolving power. A sensor’s spatial resolution works the same way: the higher it is, the smaller two objects can be while the sensor still tells them apart.
Spectral Resolution is the sensing and recording power of a sensor in different bands of the electromagnetic spectrum. It works on the same principle as a prism splitting white light into a rainbow of colours (Box: Rainbow and Prism): an instrument disperses the radiation the sensor receives and records it using detectors sensitive to specific spectral ranges.
Radiometric Resolution is the sensor’s capability to discriminate between two targets. The higher the radiometric resolution, the smaller the difference in radiance that can still be detected between two targets.
| Satellite / Sensor | Spatial Resolution (metres) | Number of Bands | Radiometric Range (grey levels) |
|---|---|---|---|
| Landsat MSS (USA) | 80.0 × 80.0 | 4 | 0-64 |
| IRS LISS -I (India) | 72.5 × 72.5 | 4 | 0-127 |
| IRS LISS -II (India) | 36.25 × 36.25 | 4 | 0-127 |
| Landsat TM (USA) | 30.00 × 30.00 | 4 | 0-255 |
| IRS LISS -III (India) | 23.00 × 23.00 | 4 | 0-127 |
| SPOT HRV -I (France) | 20.00 × 20.00 | 3 | 0-255 |
| SPOT HRV -II (France) | 10.00 × 10.00 | 1 | 0-255 |
| IRS PAN (India) | 5.80 × 5.80 | 1 | 0-127 |
Four kinds of resolution appear in this chapter: Temporal (how often the same place is revisited), Spatial (how small an object can be identified), Spectral (how many separate bands are recorded), and Radiometric (how fine a brightness difference can be told apart). A question that just says “resolution” without naming which kind almost always means Spatial.
7Data Products
An Image is a pictorial representation of a scene, regardless of which region of energy was used to detect and record it. A Photograph refers specifically to an image that has been recorded on photographic film.
“All photographs are images, but all images are not photographs.” This exact sentence is a favourite one-mark fill-in-the-blank and true/false question.
Based on how the energy is detected and recorded, remotely sensed data products fall into two broad types.
Photographic Images
- Acquired in the optical region, 0.3-0.9 µm
- Four film types: black & white, colour, black & white infrared, colour infrared
- Aerial photography normally uses black & white film
- Can be enlarged without losing information or contrast
Digital Images
- Made of discrete picture elements called pixels
- Each pixel has an intensity value and a 2-D address
- Digital Number (DN) = average intensity value of a pixel
- Smaller pixels preserve scene detail better; zooming too far shows only visible pixels and loses information
8Interpretation of Satellite Imageries
Once the sensor has collected its data, that data still has to be turned into usable information. There are two ways to do this.
Visual Interpretation
- A manual exercise
- The interpreter reads the image directly to identify objects
- The only method this chapter goes on to describe, since digital methods need dedicated hardware and software
Digital Image Processing
- Requires a combination of hardware and software
- Numerically manipulates Digital Numbers to extract information
- Outside the scope of this chapter
8.1 Elements of Visual Interpretation
Whether you notice it or not, you already use an object’s form, size, location and its relationship with its surroundings to recognise it every day. Remote sensing formalises exactly this into seven named elements, grouped into two broad categories: image characteristics (tone/colour, shape, size, pattern, texture, shadow) and terrain characteristics (location and association).
The NCERT textbook illustrates each element below with a real satellite image or aerial photograph of a named place (Kolkata, Varanasi, the Sansad Bhawan, the Qutub Minar, and others). To avoid publishing any real or identifiable satellite imagery, every one of the book’s own examples is carried here in words, inside the table below, instead of as a picture.
| Element | What it means | The book’s own example (in words) |
|---|---|---|
| 1. Tone / Colour | The grey shade (B/W) or colour hue in which an object appears, based on how much energy it reflects | Healthy vegetation reflects strongly in infrared, so it appears in a light tone or bright red in a standard False Colour Composite (FCC). Clear water absorbs most radiation and appears dark/black; turbid water reflects more and appears light bluish in FCC |
| 2. Texture | Minor tone/colour variation caused by many small features too tiny to see individually | Dense city housing gives a fine texture; low-density housing gives a coarse texture. Sugarcane/millet fields look coarse compared with the fine texture of rice/wheat fields |
| 3. Size | Object size, judged from the image’s scale or resolution | Helps separate a large industrial complex from residential housing, or judge the size and hierarchy of settlements |
| 4. Shape | An object’s outline or general form | The Sansad Bhawan’s shape is distinct from other buildings; a railway line is a long, continuously curving line, unlike a road’s sharper bends |
| 5. Shadow | Caused by the sun’s angle and the object’s height; can help or hinder identification | The Qutub Minar, mosque minarets, water tanks and poles can only be identified from their shadow. Shadow is more useful in large-scale aerial photography than in satellite images, and can also hide objects standing in the shadow of tall buildings |
| 6. Pattern | The repetitive spatial arrangement of natural or man-made features | Planned residential colonies show a uniform layout pattern; orchards and plantations show uniform inter-plant spacing; drainage and settlement types can also be told apart by their pattern |
| 7. Association | The relationship between an object and its geographical surroundings | An educational institution is usually found near a residential area, with a playground on the same premises; industrial sites sit along highways or city peripheries; slums are typically found along drains or railway lines |
| Earth surface feature | Colour in Standard FCC |
|---|---|
| Evergreen vegetation | Red to magenta |
| Deciduous vegetation | Brown to red |
| Scrubs | Light brown with red patches |
| Cropped land | Bright red |
| Fallow land | Light blue to white |
| Clear water | Dark blue to black |
| Turbid waterbody | Light blue |
| Built-up area, high density | Dark blue to bluish green |
| Built-up area, low density | Light blue |
| Rock outcrops | Light brown |
| Sandy deserts / river sand / salt-affected land | Light blue to white |
| Deep ravines | Dark green |
| Shallow ravines | Light green |
| Water-logged / wetlands | Mottled black |
For more on this topic, the NCERT textbook itself points students to three government sources: www.isro.gov.in (ISRO), www.nrsc.gov.in (National Remote Sensing Centre) and www.iirs.gov.in (Indian Institute of Remote Sensing).
- Remote sensing = acquiring information about an object with a sensor that never touches it. Term first used in the early 1960s
- Three parts of every act of remote sensing: object surface, sensor, information-carrying energy waves
- Eight stages, (a) to (h): Source → Transmission → Interaction with the surface → Propagation through the atmosphere → Detection → Conversion to data → Extraction of information → Conversion into maps/tables
- Only Visible, Infrared and Microwave regions of the EMR spectrum are used in remote sensing
- Sensors: Photographic (analogue, a camera) vs Non-photographic (digital, a scanner). Satellites use scanners
- Sun-Synchronous satellites: 700-900 km altitude, fine resolution, Earth Resources use (e.g. IRS). Geostationary satellites: ~36,000 km, coarse resolution, weather/telecom use (e.g. INSAT)
- Whiskbroom scanner: 1 rotating mirror, 1 detector. Pushbroom scanner: a linear array of many fixed detectors, count = swath ÷ resolution
- Four resolutions: Temporal (revisit time), Spatial (smallest object told apart), Spectral (number of usable bands), Radiometric (smallest brightness difference told apart)
- All photographs are images, but all images are not photographs. Digital images are made of pixels, each with a Digital Number (DN)
- Visual interpretation uses seven elements: Tone/Colour, Texture, Size, Shape, Shadow, Pattern, Association
- 1 markWhich of the following gives the correct order in which the human eye, photographic systems, and remote sensors came into use?
(a) Sensors → eye → photographic systems(b) Eye → photographic systems → sensors(c) Photographic systems → eye → sensors(d) None of the above - 1 markWhich region of the electromagnetic spectrum is NOT used in satellite remote sensing?
(a) Microwave region(b) Infrared region(c) X-rays(d) Visible region - 1 markWhich of the following is NOT used in the visual interpretation technique?
(a) Spatial arrangement of objects(b) Frequency of tonal change on the image(c) Location of an object relative to other objects(d) Digital image processing - 1 markThe term “remote sensing” was first used in:
(a) The early 1960s(b) The early 1900s(c) The 1980s(d) The early 2000s - 1 markA camera is an example of which type of sensor?
(a) Non-photographic sensor(b) Photographic sensor(c) Whiskbroom sensor(d) Pushbroom sensor - 1 markThe Indian Remote Sensing (IRS) series of satellites follows which kind of orbit?
(a) Geostationary(b) Sun-Synchronous(c) Elliptical(d) Lunar - 1 markThe INSAT series of satellites is used mainly for:
(a) Earth Resources Applications(b) Telecommunication and weather monitoring(c) Deep space exploration(d) Ocean mapping only - 1 markA Whiskbroom scanner uses:
(a) A linear array of fixed detectors(b) One rotating mirror and one detector(c) No detectors at all(d) Photographic film - 1 markIn a Pushbroom scanner, the number of detectors equals:
(a) Swath minus resolution(b) Swath multiplied by resolution(c) Swath divided by spatial resolution(d) Always exactly 1 - 1 markThe revisit time of a satellite over the same area is also known as:
(a) Spatial resolution(b) Spectral resolution(c) Radiometric resolution(d) Temporal resolution - 1 markThe ability of a sensor to distinguish two closely spaced objects as two separate objects is called:
(a) Spatial resolution(b) Temporal resolution(c) Radiometric resolution(d) Spectral resolution - 1 markWhich of the following is true?
(a) All images are photographs(b) All photographs are images, but all images are not photographs(c) Photographs and images are unrelated terms(d) A digital image is always a photograph - 1 markIndia’s earth receiving station for remote sensing data is located at:
(a) Bengaluru(b) Shadnagar, near Hyderabad(c) Thumba, near Thiruvananthapuram(d) Sriharikota
Reason (R): Gamma rays, X-rays and Ultraviolet rays are not part of the electromagnetic spectrum at all.
Reason (R): It uses a linear array of many fixed detectors, each one covering a separate ground cell (pixel) at nadir.
Reason (R): A Geostationary satellite has a coarse resolution of about 1 km × 1 km, while Sun-Synchronous satellites offer fine resolution suited to Earth Resources applications.
Reason (R): The book notes that shadow is of less use in satellite images and is more useful in large-scale aerial photography.
- 1 markName the three things that are always present in any act of remote sensing.
- 1 markWhat is a swath, in the context of a scanning sensor?
- 2 marksGive the full forms of TFOV and IFOV, and say which type of scanner they describe.
- 1 markWhat is a Digital Number (DN)?
- 2 marksName the four kinds of resolution a remote sensor can have.
- 1 markIn a standard False Colour Composite, what colour does clear water usually appear?
- 2 marksAnswer in about 30 words: Why is remote sensing a better technique than other traditional methods?
- 2 marksAnswer in about 30 words: Differentiate between the IRS and INSAT series of satellites.
- 3 marksList, in order, the eight stages involved in remote sensing.
- 3 marksDistinguish between a photographic sensor and a non-photographic sensor.
- 3 marksDescribe, in about 30 words, how a pushbroom scanner functions.
- 2 marksWhat is the difference between an image and a photograph?
- 3 marksExplain why a fresh, clear water body and a turbid water body appear differently in a satellite image.
- 2 marksWhat is the difference between spatial resolution and spectral resolution?
- 5 marksDescribe the operation of a whiskbroom scanner with the help of a diagram, and explain how it differs from a pushbroom scanner.
- 5 marksExplain the difference between Sun-Synchronous and Geostationary satellites under five headings: altitude, coverage, orbital period, resolution and uses.
- 5 marksDescribe the four kinds of resolution a remote sensor can have, with a one-line definition of each.
- 5 marksDescribe the seven elements of visual interpretation, with one example of each.
- 5 marksUsing the example of the Himalayas imaged in May and November, explain what temporal resolution allows a satellite to reveal.
- 2 marksA pushbroom scanner has a swath of 80 km and a spatial resolution of 10 m. Find the number of detectors used.
- 2 marksA pushbroom scanner has a swath of 120 km and uses 4,000 detectors. Find its spatial resolution in metres.
- 2 marksSPOT HRV-1 has a swath of 60 km and spatial resolution of 20 m. If the resolution were improved to 10 m while the swath stayed the same, how many detectors would be needed?