
Covers T.R. Jain & V.K. Ohri (2026-27) ch 9-10. Based on NCERT Statistics for Economics, Chapter 5 (Reprint 2026-27) and the CBSE curriculum 2026-27 (Part A, Unit 3).
- summarise a whole set of data by one representative value (an average)
- find the arithmetic mean by the direct, assumed mean and step deviation methods, for individual, discrete and continuous series
- find the median by formula and from the ‘less than’ and ‘more than’ ogives
- find the mode by inspection, by formula and from a histogram
- interpret every result in one line and choose the right average for a situation
1 Central tendency: meaning and need
- After showing data in tables and graphs, the next step is to summarise the whole data in one number; a measure of central tendency is this numerical method
- Everyday examples: average marks of a class in a test, average rainfall in an area, average production in a factory, average income of people in a locality or a firm
- Baiju is a farmer who grows food grains in Balapur village of Buxar district in Bihar
- The village has 50 small farmers; Baiju has 1 acre of land
- To judge his economic condition, you would ask whether his land is:
- above average in the ordinary sense? → arithmetic mean
- above what half the farmers own? → median
- above what most of the farmers own? → mode
- For this, the land data of all 50 farmers must be summarised into one value
A measure of central tendency summarises the data in a single value in such a way that this single value can represent the entire data. It is a way of summarising the data in the form of a typical or representative value.
The three common averages
Arithmetic mean
The “average” in the ordinary sense; the most used
Median
The middle value; half the values are below it, half above
Mode
The value that occurs most often
- These measures are also called averages; they are the three most commonly used
- Two more averages exist, the geometric mean and the harmonic mean, which suit certain situations; this chapter is limited to the three above
2 Arithmetic Mean
The arithmetic mean is the sum of the values of all observations divided by the number of observations. It is denoted by and is the most commonly used measure of central tendency.
Income (₹): 1600, 1500, 1400, 1525, 1625, 1630
₹1,547
Interpretation: on an average, a family earns ₹1,547 a month.
Finding the mean: first identify the series
Individual series (ungrouped)
Only values are given, e.g. 40, 50, 55
Discrete series
Each value comes with its frequency (f)
Continuous series
Class intervals are given; use mid-points (m)
Three methods work for every type of series: the direct method, the assumed mean method and the step deviation method. All three always give the same answer; the last two only make the arithmetic easier.
2.1 Ungrouped data (individual series)
(a) Direct method
Divide the sum of all observations in the series by the total number of observations:
Given (Example 1)
Marks of students in an economics test: 40, 50, 55, 78, 58;
To find
Arithmetic mean
Formula:
Substitution:
Answer: 56.2 marks
Interpretation: the average mark of students in the economics test is 56.2.
(b) Assumed mean method
- When observations are many or the figures are large, adding them directly is difficult and slow
- On the basis of logic or experience, assume one figure as the mean: this is the assumed mean (A)
- Take the deviation of each observation from A, , add them to get , divide by and add the result to A
- Any value, whether in the data or not, can be the assumed mean; to keep the arithmetic simple, choose a centrally located value
(c) Step deviation method
- Divide all the deviations from the assumed mean by a common factor (c) to make them even smaller:
- Purpose: to avoid large numerical figures; at the end, multiply by to come back to the right scale
Example 2: Weekly income (₹) of 10 families. Compute the mean family income. Assumed mean , common factor .
| Family | Income (X) | d = X − 850 | d′ = (X − 850)/10 |
|---|---|---|---|
| A | 850 | 0 | 0 |
| B | 700 | −150 | −15 |
| C | 100 | −750 | −75 |
| D | 750 | −100 | −10 |
| E | 5000 | +4150 | +415 |
| F | 80 | −770 | −77 |
| G | 420 | −430 | −43 |
| H | 2500 | +1650 | +165 |
| I | 400 | −450 | −45 |
| J | 360 | −490 | −49 |
| Total | ΣX = 11160 | Σd = +2660 | Σd′ = +266 |
Direct method:
Assumed mean method:
Step deviation method:
Answer: mean weekly income ₹1,116
Interpretation: the average weekly income of these families is ₹1,116. Note that 8 of the 10 families earn less than this, because large values such as ₹5,000 and ₹2,500 pull the mean up.
2.2 Discrete series
- Multiply the frequency (f) of each observation by its value (X), add the products () and divide by the sum of frequencies ()
- In the assumed mean and step deviation methods, each deviation is also multiplied by its frequency (, )
Example 3: Plots in a housing colony come in only three sizes: 100, 200 and 300 sq. metre, and the numbers of plots are 200, 50 and 10. Find the mean plot size (, ).
| Plot size X (sq. metre) | No. of plots (f) | fX | d = X − 200 | fd | d′ = (X − 200)/100 | fd′ |
|---|---|---|---|---|---|---|
| 100 | 200 | 20000 | −100 | −20000 | −1 | −200 |
| 200 | 50 | 10000 | 0 | 0 | 0 | 0 |
| 300 | 10 | 3000 | +100 | +1000 | +1 | +10 |
| Total | Σf = 260 | ΣfX = 33000 | Σfd = −19000 | Σfd′ = −190 |
Direct:
Assumed mean:
Step deviation:
Answer: 126.92 sq. metre
Interpretation: the mean plot size in the colony is about 127 sq. metre; it is close to 100 because most plots (200) are small.
2.3 Continuous series
- Class intervals are given; the process is the same as for a discrete series, except that the mid-point (m) of each class replaces X
- Mid-point = (lower limit + upper limit) ÷ 2, e.g. the mid-point of 10-20 is 15
- Class intervals can be of three kinds; the mean is found the same way in all three:
| Class interval | How to recognise it | Book’s example |
|---|---|---|
| Exclusive | Upper limit of one class is the lower limit of the next | 0-10, 10-20 |
| Inclusive | Both limits included; a gap between classes | 0-9, 10-19 |
| Unequal | Classes of different widths | 0-20, 20-50 |
Example 4: Calculate the average marks of 70 students by (a) the direct method (b) the step deviation method (, ).
| Marks | No. of students (f) | Mid-point (m) | fm | d′ = (m − 35)/10 | fd′ |
|---|---|---|---|---|---|
| 0-10 | 5 | 5 | 25 | −3 | −15 |
| 10-20 | 12 | 15 | 180 | −2 | −24 |
| 20-30 | 15 | 25 | 375 | −1 | −15 |
| 30-40 | 25 | 35 | 875 | 0 | 0 |
| 40-50 | 8 | 45 | 360 | 1 | 8 |
| 50-60 | 3 | 55 | 165 | 2 | 6 |
| 60-70 | 2 | 65 | 130 | 3 | 6 |
| Total | Σf = 70 | Σfm = 2110 | Σfd′ = −34 |
(a) Direct method:
(b) Step deviation method:
Answer: 30.14 marks
Interpretation: the average mark of these 70 students is about 30.
- Multiplying f by the lower class limit in a continuous series; always multiply by the mid-point m
- Forgetting the final × c in the step deviation method: 35 + (−34/70) gives 34.51, which is wrong
- Dropping the minus sign: Σfd′ is −34, not +34; flipping it gives 39.86
- Using ΣX/N in a discrete series (ignoring frequencies); the correct formula is ΣfX/Σf
- Leaving out the unit (₹, marks, sq. metre); the marking scheme gives a mark for it
2.4 Two interesting properties of the arithmetic mean
Deviations add up to zero
The sum of deviations of items about the arithmetic mean is always zero:
Affected by extreme values
Any very large or very small value at either end can push the mean up or down
- Mean ; deviations ; sum ✓ (first property)
- Add 2 to every observation (6, 8, 10, 12, 14) and the mean also rises by exactly 2, to 10; conversely, for the mean to rise by 2, the total must rise by 10, i.e. each observation by 2 on average
- If the first three items rise by 2 each, the total rises by 6; to keep the mean at 8, the last two items together must fall by 6, e.g. 10 → 7 and 12 → 9
- Replace 12 by 96: mean ; one extreme value moved the mean from 8 to 24.8, though four of the five values are 10 or less (second property)
2.5 Weighted arithmetic mean
- Sometimes it is important to give weights to items according to their importance
- The book’s example: the average price of mangoes (price ) and potatoes (price ); the simple mean is
- To give more importance to the rise in the price of potatoes, use the share of mangoes in the consumer’s budget () and the share of potatoes () as weights:
- When prices rise, you are interested in the rise in prices of the commodities that matter more to you; you will read more in Chapter 7 (Index Numbers)
The weighted arithmetic mean gives each item a weight (w) according to its importance, adds the weighted values and divides by the sum of the weights:
Given: mangoes ₹120 per kg, budget share (weight) 1; potatoes ₹30 per kg, weight 3
Formula:
Substitution:
Answer: weighted mean price ₹52.50 per kg (the simple mean would be ₹75)
Interpretation: potatoes take a bigger share of the budget, so the weighted mean is pulled towards the potato price.
3 Median
The median is that positional value of the variable which divides the distribution into two equal parts: one part has all values greater than or equal to the median and the other has all values less than or equal to it. It is the “middle” element when the data set is arranged in order of magnitude.
- The median depends on the position of values, so it remains unaffected if, say, the size of the largest value increases
- The first step is always: arrange the data in ascending order (smallest to largest)
3.1 Individual series
Observations: 5, 7, 6, 1, 8, 10, 12, 4, 3 ()
Ascending order: 1, 3, 4, 5, 6, 7, 8, 10, 12
Position $= \dfrac{9+1}{2} = $ 5th item → median = 6
Interpretation: half the scores are larger than 6 and half are smaller.
Marks of 20 students: 25, 72, 28, 65, 29, 60, 30, 54, 32, 53, 33, 52, 35, 51, 42, 48, 45, 47, 46, 33
Ascending order: 25, 28, 29, 30, 32, 33, 33, 35, 42, 45, 46, 47, 48, 51, 52, 53, 54, 60, 65, 72
Position $= \dfrac{20+1}{2} = $ 10.5th item, i.e. between the 10th (45) and 11th (46) items
Median 45.5 marks
Interpretation: with an even number there are two middle values; the median is their arithmetic mean.
3.2 Discrete series
- The position of the median is still the th item ()
- Locate it through the cumulative frequency (c.f.): the value against the first c.f. that reaches this item is the median
Cumulative frequency is the total of all frequencies up to a value (or class); it tells how many items have been reached up to that point.
Example 7: Income (₹) 10, 20, 30, 40; number of persons 2, 4, 10, 4. Calculate the median income.
| Income (₹) | No. of persons (f) | Cumulative frequency (c.f.) |
|---|---|---|
| 10 | 2 | 2 |
| 20 | 4 | 6 |
| 30 | 10 | 16 |
| 40 | 4 | 20 |
Position $= \dfrac{N+1}{2} = \dfrac{20+1}{2} = $ 10.5th observation
The 10.5th observation lies in c.f. 16 (only 6 persons are reached by c.f. 6)
Answer: median income = ₹30
Interpretation: half the persons earn ₹30 or less, half earn ₹30 or more.
3.3 Continuous series
- First locate the median class: the class where the th item lies (note: N/2, not (N+1)/2)
- Then apply the formula; no adjustment is required even if the classes are of unequal size
Example 8: Daily wages of 160 workers in a factory. Compute the median daily wage. (The book gives the data from 55-60 down to 20-25; the table writes the classes from smallest to largest.)
| Daily wages (₹) | No. of workers (f) | Cumulative frequency |
|---|---|---|
| 20-25 | 14 | 14 |
| 25-30 | 28 | 42 |
| 30-35 | 33 | 75 |
| 35-40 | 30 | 105 |
| 40-45 | 20 | 125 |
| 45-50 | 15 | 140 |
| 50-55 | 13 | 153 |
| 55-60 | 7 | 160 |
Given
; the th item lies in class 35-40 (c.f. 105) → , , ,
To find
Median daily wage
Formula: Median
Substitution: Median
Answer: ₹35.83
Interpretation: 50% of the workers get ₹35.83 or less and 50% get this wage or more.
The median is not sensitive to all the values in the series; it concentrates on the values of the central items. That is why extreme values do not move it.
3.4 Median from ogives (graphic method)
- An ogive is also called a cumulative frequency curve (Chapter 4); there are two kinds:
- ‘Less than’ ogive: ‘less than’ cumulative frequencies plotted against the upper limits of the classes; it is never decreasing
- ‘More than’ ogive: ‘more than’ cumulative frequencies plotted against the lower limits; it is never increasing
- The intersection point of the two ogives gives the median: drop a perpendicular from it to the x-axis
An ogive (cumulative frequency curve) plots cumulative frequencies on the y-axis against the class limits; the ‘less than’ and ‘more than’ ogives cut each other at the median.
Both ogives from Example 8’s data:
| Wages | ‘Less than’ c.f. | Wages | ‘More than’ c.f. |
|---|---|---|---|
| Less than 25 | 14 | More than 20 | 160 |
| Less than 30 | 42 | More than 25 | 146 |
| Less than 35 | 75 | More than 30 | 118 |
| Less than 40 | 105 | More than 35 | 85 |
| Less than 45 | 125 | More than 40 | 55 |
| Less than 50 | 140 | More than 45 | 35 |
| Less than 55 | 153 | More than 50 | 20 |
| Less than 60 | 160 | More than 55 | 7 |

- In class 35-40 the ‘less than’ ogive rises from 75 to 105 and the ‘more than’ ogive falls from 85 to 55
- They meet at , where
- Median from ogives = ₹35.83 = median by formula ✓
- With only the ‘less than’ ogive, draw a horizontal line from on the y-axis; the x-value where it cuts the ogive is the median
3.5 Extreme values: median versus mean
The book’s activity table (Table 5.4): three values in each series, only the largest one changes.
| Series | X (variable values) | Mean | Median |
|---|---|---|---|
| A | 1, 2, 3 | 2 | 2 |
| B | 1, 2, 30 | 11 | 2 |
| C | 1, 2, 300 | 101 | 2 |
| D | 1, 2, 3000 | 1001 | 2 |
- What do you observe? The mean jumps from 2 to 1001; the median stays at 2 every time
- Outliers (extreme values) are values very far from the rest of the data (like 3000); the median is not affected by them
- Is the median a better method? When the data have extreme values (incomes, land holdings), the median is a better summary; when they do not, the mean, which uses every observation, is better
- Picking the middle value without arranging the data; always arrange first
- Using (N+1)/2 in a continuous series; continuous uses N/2, individual and discrete use (N+1)/2
- Putting the median class’s own c.f. into the formula; use the c.f. of the preceding class (75 in Example 8, not 105)
- If the data are in descending order (55-60 first), rearrange them in ascending order before building the c.f.
- Taking L = 15 directly for inclusive classes (10-14, 15-19); first convert them to exclusive (14.5-19.5) by subtracting and adding 0.5
4 Quartiles and percentiles (Not in CBSE 2026-27 syllabus)
This part is not in the CBSE 2026-27 syllabus but is in the book; state boards and the book’s Exercises 3(iv) and 8 use it.
Quartiles are the measures which divide the data into four equal parts, each containing an equal number of observations. There are three quartiles: (lower quartile), (median) and (upper quartile).
| Quartile | Items below | Items above | Position (individual/discrete) |
|---|---|---|---|
| lower quartile | 25% | 75% | th item |
| median | 50% | 50% | th item |
| upper quartile | 75% | 25% | th item |
and are the two limits within which the central 50% of the data lies.
Marks of ten students: 22, 26, 14, 30, 18, 11, 35, 41, 12, 32
Ascending order: 11, 12, 14, 18, 22, 26, 30, 32, 35, 41
$Q_1 = $ size of the th item 2nd item 3rd item 2nd item
13.5 marks
Find Q3 yourself: th item 32.75 marks
- In a continuous series, quartiles follow the median formula with (for ) or (for ) in place of (as in Exercise 8)
Percentiles divide the distribution into hundred equal parts, giving 99 dividing positions . is the median value.
An 82 percentile in a management entrance examination means your position is below 18 per cent of the candidates (82% are at or below you). If one lakh students appeared, about 18,000 are above you, so you stand at about the 18,001st place.
5 Mode
- Sometimes you want the most typical value of a series, around which the maximum concentration of items occurs
- Examples: a manufacturer wants the size of shoes with maximum demand, or the style of shirt that is demanded most; here the mode is the most appropriate measure
- The word mode comes from the French word “la Mode”, which signifies the most fashionable value of a distribution
The mode is the value which occurs most frequently in a series; it is the most frequently observed data value. It is denoted by .
5.1 Individual and discrete series: by inspection
- Data 1, 2, 3, 4, 4, 5: 4 occurs twice, the rest once → mode = 4
- Example 10: variable 10, 20, 30, 40, 50; frequency 2, 8, 20, 10, 5 → the maximum frequency is 20, so mode = 30; there is one mode, so the data are unimodal
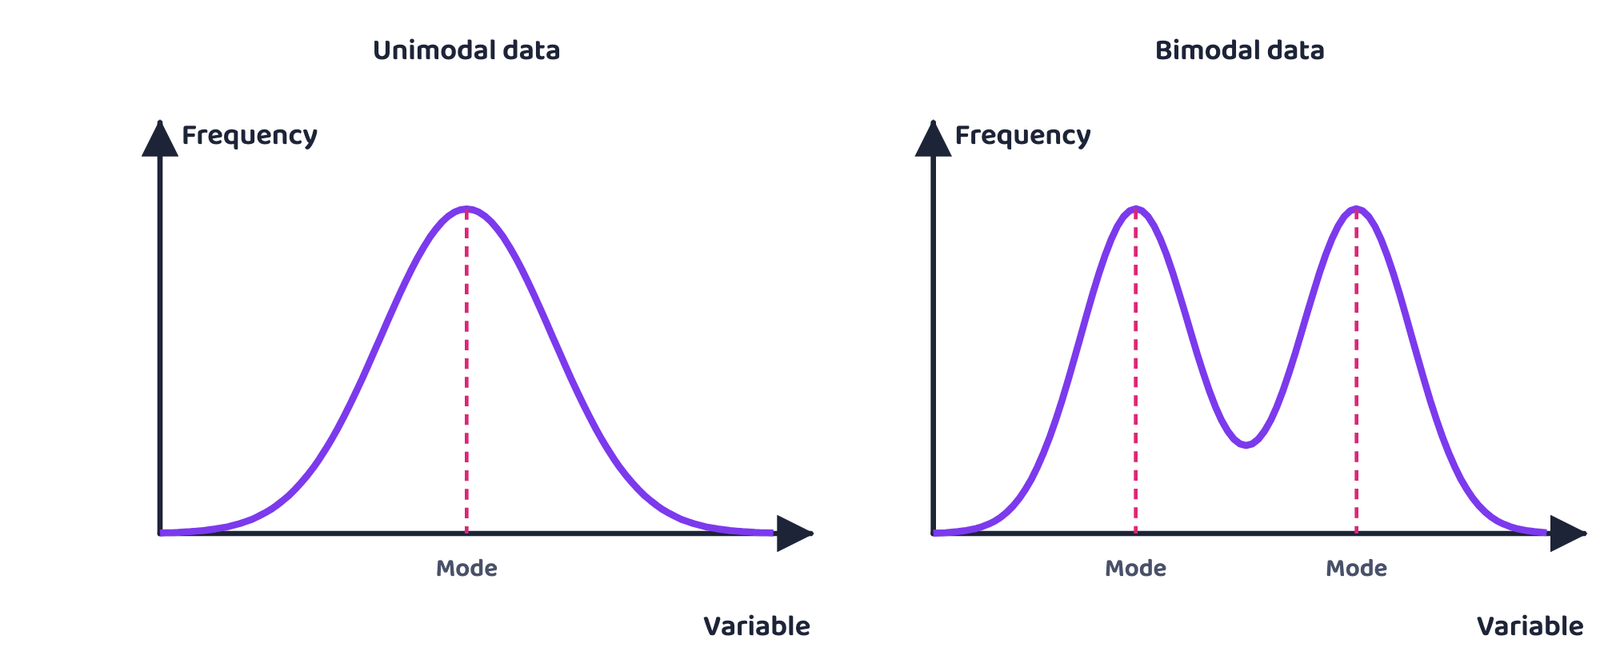
- A data set always has exactly one (unique) arithmetic mean and one median, but the mode need not be unique:
Unimodal
Only one mode (Example 10)
Bimodal
Two modes
Multimodal
More than two modes
No mode
No value is more frequent than any other: 1, 1, 2, 2, 3, 3, 4, 4
5.2 Continuous series: by formula
- The modal class is the class with the largest frequency
- Conditions: class intervals must be equal and the series exclusive; if mid-points are given, first obtain the class intervals
Example 11: Calculate the modal monthly income of worker families. The data are a ‘less than’ cumulative frequency distribution: less than 50: 97, less than 45: 95, less than 40: 90, less than 35: 80, less than 30: 60, less than 25: 30, less than 20: 12, less than 15: 4 (income in ’000 ₹).
Step 1: build the ordinary frequency table (frequency of a class = its ‘less than’ c.f. − the previous ‘less than’ c.f.):
| Income group (’000 ₹) | Frequency |
|---|---|
| 45-50 | 97 − 95 = 2 |
| 40-45 | 95 − 90 = 5 |
| 35-40 | 90 − 80 = 10 |
| 30-35 | 80 − 60 = 20 |
| 25-30 | 60 − 30 = 30 |
| 20-25 | 30 − 12 = 18 |
| 15-20 | 12 − 4 = 8 |
| 10-15 | 4 |
Given
Modal class 25-30 (largest frequency 30); ; preceding class 20-25 has frequency 18; succeeding class 30-35 has frequency 20;
To find
Modal monthly income
,
Formula:
Substitution:
Answer: 27.727 thousand ₹, i.e. about ₹27,727 a month
Interpretation: the largest number of worker families earn around ₹27,700 a month.
5.3 Mode from a histogram (graphic method)
- Draw the histogram of the frequency distribution; the tallest bar is the modal class
- Join the top-left corner of the modal bar to the top-left corner of the next bar, and the top-right corner of the modal bar to the top-right corner of the previous bar
- From the point where the two lines cross, drop a perpendicular to the x-axis; that is the mode
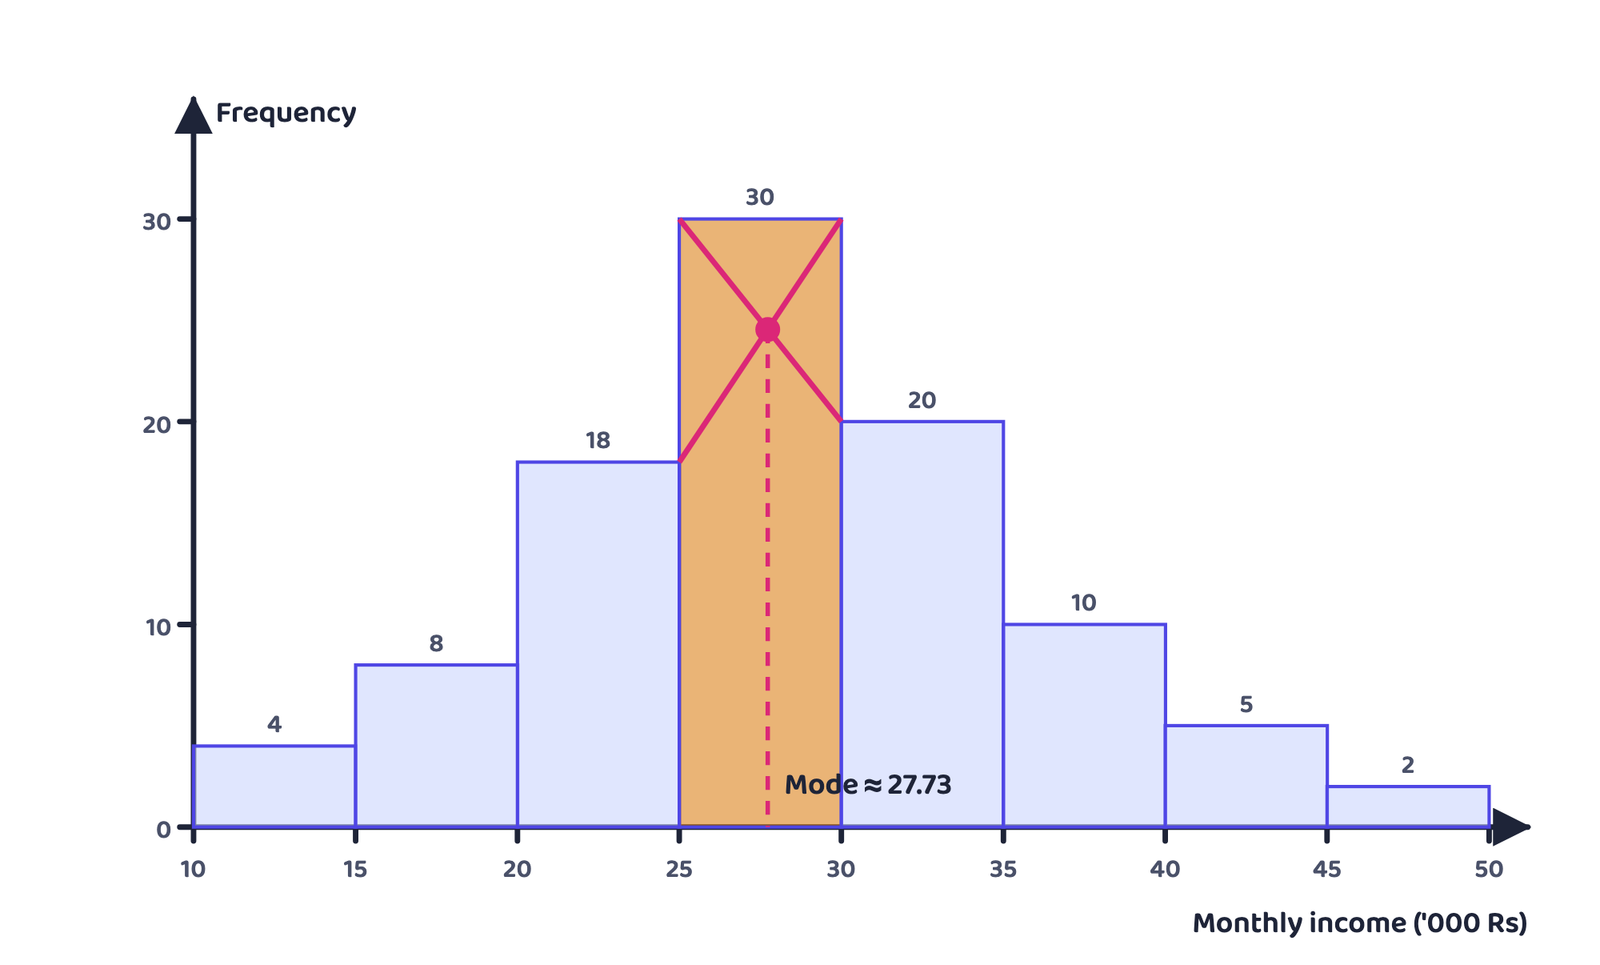
The two diagonals cross at ; graphic mode = formula mode ✓. The formula is built from exactly this geometry.
- Treating ‘less than’ cumulative frequencies as frequencies; subtract first to get ordinary frequencies (Step 1 of Example 11)
- Swapping and : always uses the preceding class (12), the succeeding class (10)
- Applying the formula directly to unequal or inclusive classes; make them equal and exclusive first
- Dropping the unit “thousand ₹”; 27.727 means ₹27,727, not ₹27.73
6 Relative position of arithmetic mean, median and mode
- Write arithmetic mean = , median = , mode = (suffixes e, i, o in alphabetical order)
- Their relative magnitude is or
- The median is always between the arithmetic mean and the mode
Mean ; median ; mode (modal class 30-35)
Order: , i.e. ; the median is in between ✓
7 Conclusion: which average when?
| Basis | Arithmetic mean | Median | Mode |
|---|---|---|---|
| Nature | Mathematical average, based on all observations | Positional value (the middle one) | Most frequently occurring value |
| Effect of extreme values | Unduly affected | Not affected | Not affected |
| Calculation | Simple | Needs ordering | Inspection or formula |
| Graphic method | No | Yes, from ogives | Yes, from a histogram |
| Open-ended distribution | Difficult (the open class must be assumed) | Easy | Easy |
| Qualitative data | Not suitable (qualities cannot be added) | Qualitative measurement where the quality can be ranked (e.g. intelligence) | Describing qualitative data (e.g. most preferred food) |
| Unique? | Yes | Yes | Not necessarily (bimodal/multimodal) |
- The arithmetic mean is the most commonly used average: simple to calculate and based on all the observations, but unduly affected by extreme items
- The median is a better summary for such data
- The mode is generally used to describe qualitative data
- The median and the mode can be easily computed graphically and for open-ended distributions
- So choose the average by the purpose of analysis and the nature of the distribution
An open-ended distribution is a frequency distribution whose first class is open at the bottom or last class open at the top, such as “less than 100” or “400 and above”.
- A shoe company making shoes for adults only wants the most popular size → mode (the size demanded most)
- Companies producing diaries and notebooks, school bags, jeans and T-shirts → mode, because they must make more of the size or type that sells most; an “average size” (mean) may fit nobody
- A class survey of preference for Chinese food → preference is qualitative, so mode
- Can mode be located graphically? Yes, from a histogram (section 5.3)
| Measure | Individual | Discrete | Continuous |
|---|---|---|---|
| Mean: direct | |||
| Mean: assumed mean | |||
| Mean: step deviation | |||
| Weighted mean | |||
| Median | th item | th item, via c.f. | |
| Quartiles | th, th item | With and , median-type formula | |
| Mode | The most frequent value | ||
- A measure of central tendency summarises the whole data in one representative value; the three common averages are mean, median and mode
- Mean = ΣX/N; discrete ΣfX/Σf; continuous Σfm/Σf; the assumed mean and step deviation methods give the same answer and only ease the arithmetic
- Deviations from the mean always add up to zero; the mean is affected by extreme values
- Weighted mean = Σwx/Σw (mangoes and potatoes, budget shares as weights)
- Median = the middle value; arrange first; individual/discrete (N+1)/2, continuous N/2 and L + (N/2 − c.f.)/f × h
- The ‘less than’ and ‘more than’ ogives cross at the median (Example 8: ₹35.83 both ways)
- Quartiles four parts, percentiles a hundred parts (Not in CBSE 2026-27 syllabus)
- Mode = most frequent; continuous L + D1/(D1 + D2) × h; also from a histogram
- The median always lies between the mean and the mode: Me > Mi > Mo or Me < Mi < Mo
- Describing qualitative data → mode; qualitative measurement (ranking), extreme values or open-ended data → median; otherwise → mean
- Can I find the mean of one question by all three methods and show the answer is the same?
- Can I write the continuous-series median formula with the meaning of every letter?
- Can I draw the ‘less than’ and ‘more than’ ogives and read off the median?
- Can I turn a ‘less than’ cumulative table into ordinary frequencies and find the mode?
- Do I write the unit and a one-line interpretation after every answer?