
All the questions from the Exercise at the end of NCERT’s Practical Work in Geography Chapter 6, “Introduction to Remote Sensing” (Chapter 26 on this site), in the exact order and wording as printed in the book (English edition), with a full solution to every question, followed by the chapter’s Activity.
1 Choose the right answer from the four alternatives given below
Q. Remote sensing of objects can be done through various means such as A. remote sensors, B. human eyes and C. photographic system. Which of the following represents the true order of their evolution? (a) ABC (b) BCA (c) CAB (d) None of the above
Answer: (b) BCA. The human eye is the oldest of the three, evolved long before any instrument; the photographic camera came next, as an instrument that could record what the eye saw onto film; and dedicated remote-sensing systems (sensors carried on aircraft and satellites) are the most recent development of the three. So the true order of their evolution is B (human eyes) → C (photographic system) → A (remote sensors), i.e. BCA.
Q. Which of the following regions of Electromagnetic spectrum is not used in satellite remote sensing? (a) Microwave region (b) Infrared region (c) X-rays (d) Visible region
Answer: (c) X-rays. The chapter states clearly that although the electromagnetic spectrum has many regions (gamma, X-ray, ultraviolet, visible, infrared, microwave, radio), only the visible, infrared and microwave regions are actually used in remote sensing. X-rays are not among these three.
Q. Which of the following is not used in visual interpretation technique? (a) Spatial arrangements of objects (b) Frequency of tonal change on the image (c) Location of objects with respect to other objects (d) Digital image processing
Answer: (d) Digital image processing. The chapter explains that information can be extracted from remote sensing data in two separate ways: visual interpretation (a manual exercise of reading images to identify objects) and digital image processing (which needs a combination of hardware and software). Options (a), (b) and (c) are all genuine elements of visual interpretation: spatial arrangement is the basis of pattern, frequency of tonal change is a form of tone/texture reading, and location with respect to other objects is the definition of association. Digital image processing, however, is explicitly the other, separate route, not a technique used within visual interpretation.
2 Answer the following questions in about 30 words
Q. Why is remote sensing a better technique than other traditional methods?
Answer: Unlike ground surveys, remote sensing collects information about large, even inaccessible, areas without any physical contact with the object, using sensors that respond to a much wider range of radiation than the human eye, giving repeated, wide-area coverage quickly and at lower cost.
Q. Differentiate between IRS and INSAT series of satellites.
Answer: IRS satellites are sun-synchronous, orbiting at 700-900 km altitude, giving fine resolution (182 m to 1 m) for Earth Resources Applications. INSAT satellites are geostationary, orbiting at about 36,000 km with a 24-hour period, giving coarse resolution (about 1 km x 1 km) for telecommunication and weather monitoring.
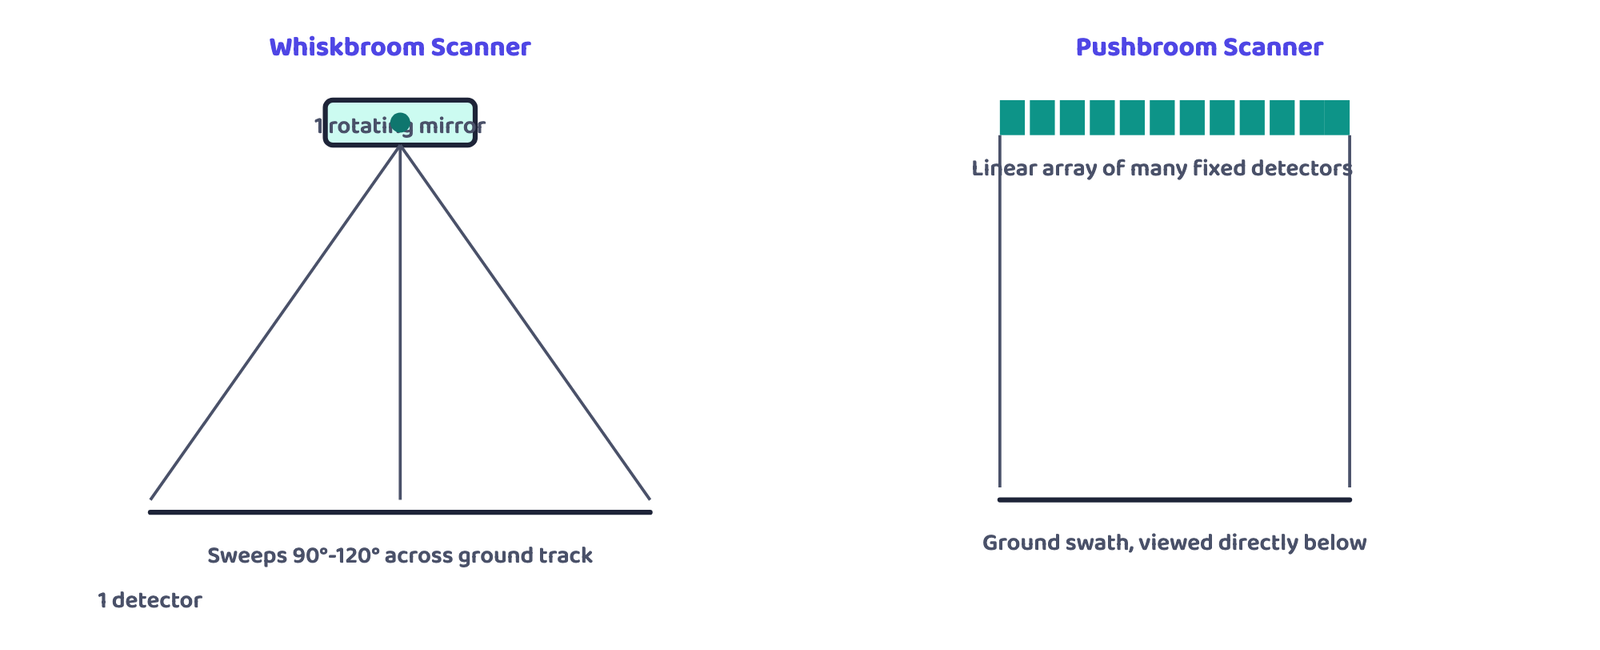
Q. Describe in brief the functioning of pushbroom scanner.
Answer: A pushbroom scanner has no moving mirror; instead it uses a linear array of many fixed detectors, whose number equals the swath divided by the spatial resolution. Each detector records the energy reflected from one ground cell (pixel) at nadir, so an entire scan line is captured at once.
3 Answer the following questions in about 125 words
Q. Describe the operation of a whiskbroom scanner with the help of a diagram. Explain how it is different from pushbroom scanner.
Answer: A whiskbroom scanner is built around a reception system of a single rotating mirror and a single detector. As the mirror completes a rotation, the detector sweeps across the sensor’s field of view, oscillating between 90° and 120°, building the scene one narrow scan line at a time, a bit-by-bit, line-by-line process. The full angular extent the mirror sweeps is the Total Field of View (TFOV), while the fixed, narrow patch the detector views at any single instant is the Instantaneous Field of View (IFOV). In the diagram, the satellite moves forward along its orbit (along the track) while the rotating mirror swings the detector’s view from side to side across the track, tracing successive scan lines that together build up the image. A pushbroom scanner differs fundamentally: it replaces the rotating mirror and single detector with a linear array of many fixed detectors laid side by side across the swath, so it has no moving mechanical part, and it captures an entire line of the scene in one instant rather than building it up detector-sweep by detector-sweep.
Q. Identify and list the changes that can be observed in the vegetation of Himalayas (Fig.6.9).
Answer: Figure 6.9 shows two IRS images of the Himalayas and the northern Indian plain, one taken in May and one in November; comparing them is an example of temporal resolution (the same area imaged again after an interval). The changes that can be listed from the book’s caption: (1) In the May image, the red patches show coniferous vegetation. (2) In the November image, additional red patches appear, which show deciduous plants. (3) The November image also shows a light red colour, which is related to the crops. So between May and November the image records deciduous vegetation and crops in addition to the coniferous cover. (Healthy vegetation reflects strongly in the infrared region and appears red in a standard False Colour Composite, which is why vegetation shows up as red in these images.)
Q. Identify various features marked on IRS IC LISS III imagery shown below. Draw clues from the description of the elements of image interpretation discussed and the colours in which various objects appear on a Standard False Colour Composite.
Answer: The book gives no answer key for this image, so each numbered feature is identified here by applying Table 6.2 (colour signatures on a standard FCC) together with the elements of interpretation (tone, texture, shape, pattern, association):
- 14: a broad, winding black band: clear water (dark blue to black), i.e. a river.
- 13: large bright red area beside the river: healthy vegetation / cropped land on the river’s flood plain.
- 3, 5, 11 and 15: smaller red patches inside the built-up area: vegetation such as parks, gardens and tree cover.
- 4 and 7: light blue areas with a regular, grid-like pattern: planned built-up (residential) areas; light blue indicates low-density built-up area.
- 9 and 12: blue to bluish-green areas with a fine texture: densely built-up parts of the city.
- 8 and 10: long, thin dark lines running across the scene: roads, railway lines or a canal, identified by their linear shape.
- 1, 2 and 6: very bright white to light blue spots: open ground, sand or bare land (light blue to white in Table 6.2), or very bright roofs.
Your teacher may use the local names of these places; the method (colour + shape + pattern + association) is what the activity tests.
Question 1’s three MCQs test exact facts: remember the order BCA, the excluded X-ray region, and that digital image processing is explicitly NOT part of visual interpretation. Questions 2 and 3 carry the chapter’s long answers: the IRS/INSAT comparison and the whiskbroom-versus-pushbroom description (with the SPOT HRV-I 3,000-detector calculation) are worth writing out in full, in your own words, at least once before the exam.