- What a topographical map is, who prepares it, and the two series and five scales it comes in
- How to read contours: what a contour interval is, and why the spacing between contours changes even when that interval does not
- How to recognise a slope type and a landform purely from the way its contours are spaced and shaped
- How to draw a cross-section (side profile) of the ground from a set of contours, step by step
- How settlements, transport and land use are shown and read on a topographical sheet
- How to interpret a topographical sheet under its five standard heads, and the procedure for doing it systematically
1What Is a Topographical Map?
You already know that maps are classified by scale and by function. A topographical map is a general-purpose map: it is drawn at a relatively large scale and shows both the natural features of an area (relief, vegetation, water bodies) and the cultural features people have added to it (cultivated land, settlements, transport networks). Every country’s National Mapping Organisation prepares and publishes these maps; in India, that job belongs to the Survey of India.
Topographic Map is a map of a small area drawn on a large scale, depicting detailed surface features, both natural and man-made. Relief on this map is shown by contours.
Topographical maps matter because they are base maps: almost every other special-purpose map (a soil map, a land-use map, a settlement map) is drawn on top of one. They are also published as a series, so that every sheet in the series shares the same reference point, scale, projection, conventional signs, symbols and colours.
1.1 The two series of Indian topographical maps
India and Adjacent Countries Series
Prepared by the Survey of India until the Delhi Survey Conference of 1937, after which coverage of neighbouring countries was dropped and India alone continued to be mapped, now to the specifications of the International Map Series. The old series’ numbering system and layout plan were kept for the new one, which is why the numbering looks older than the maps themselves.
International Map Series of the World
Designed to produce standardised topographical maps for the entire world, at a scale of 1 : 10,00,000 or 1 : 2,50,000.
1.2 The five scales, and what each sheet covers
Survey of India topographical maps are drawn at five fixed scales. A larger denominator means a smaller scale and a bigger area covered by one sheet, so the coverage in degrees and minutes shrinks as the scale gets larger (that is, as the denominator gets smaller).
| Scale | Latitude × Longitude covered by one sheet |
|---|---|
| 1 : 10,00,000 | 4° × 4° |
| 1 : 2,50,000 | 1° × 1° |
| 1 : 1,25,000 | 30′ × 30′ |
| 1 : 50,000 | 15′ × 15′ |
| 1 : 25,000 | 5′ × 7′30″ |
Learn the table in order: as the scale becomes larger (a bigger fraction, smaller denominator), the area a single sheet covers becomes smaller, so the degree-and-minute coverage in the second column shrinks all the way down the table. This one sentence answers most “how are the scales related” questions.
1.3 How a sheet gets its number
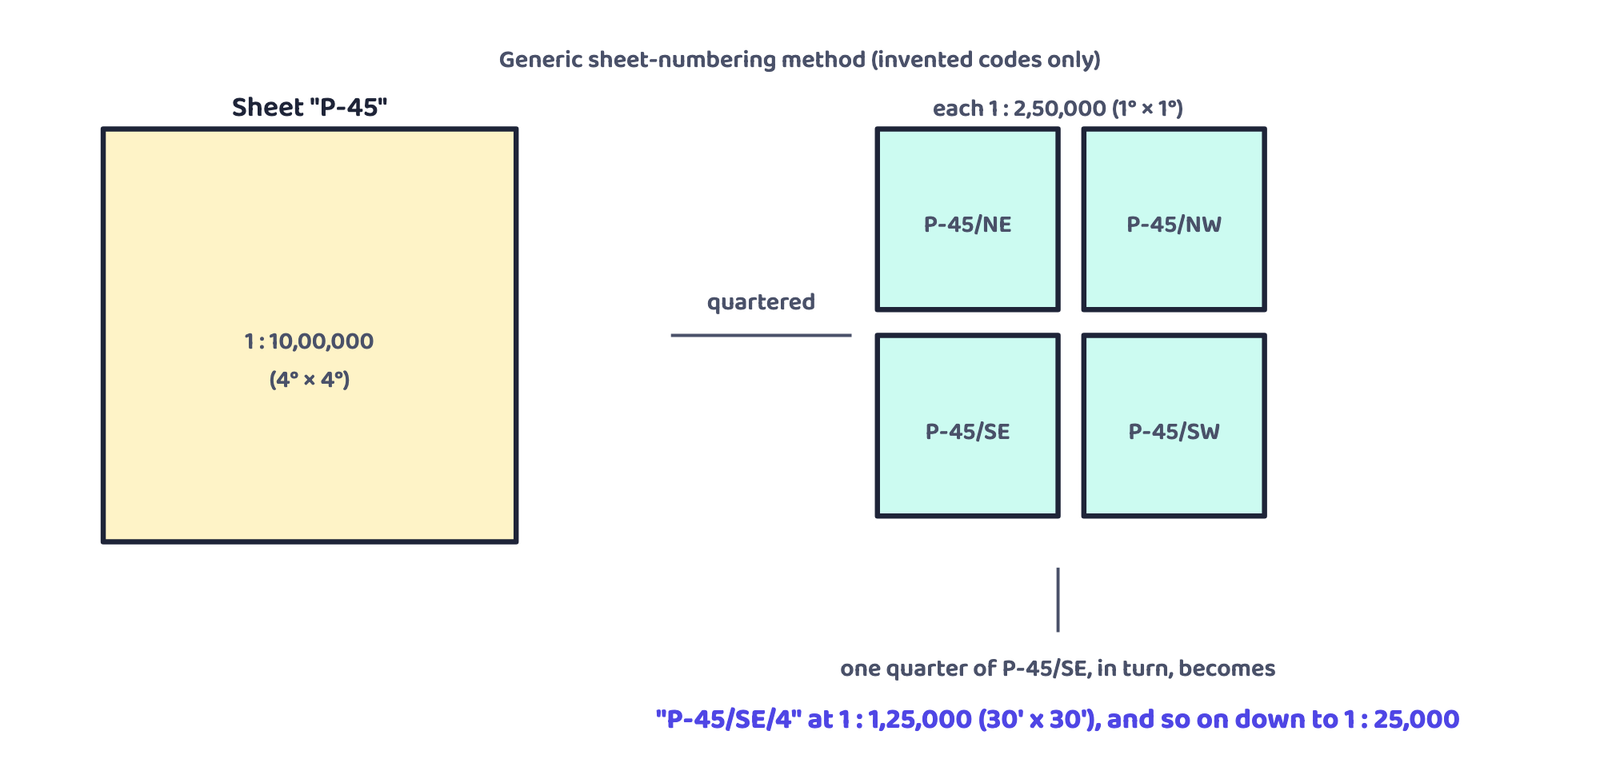
Because each series is built on the same reference grid, every sheet’s number can be worked out from where it sits inside the next larger sheet above it. The worked method below uses invented letters and numbers, not a real place, to show how the system works: a real 1 : 10,00,000 sheet is quartered into four 1 : 2,50,000 sheets, each of those is further divided for the larger scales, and each smaller sheet takes the parent sheet’s number plus a suffix that says which quarter it came from.
2Reading a Topographical Sheet
The study of a topographical map is straightforward once you know what to look for. First, orient yourself: find the north line and the scale, and turn the sheet (or yourself) so that north on the sheet matches north on the ground. Then get familiar with the legend, the conventional signs and the colours printed on the sheet, since these are what turn a page full of lines into readable information.
Conventional signs and symbols are internationally accepted. That means anyone, anywhere in the world, can read the cultural and physical features on a topographical sheet without knowing a single word of the local language, as long as they know the legend.
2.1 Methods of relief representation
Over the years, several methods have been used to show the relief (the elevations and depressions) of the earth’s surface on a map. A map that shows these features is itself called a relief map.
Five methods are named, but only two are used predominantly on all topographical maps to depict relief: contours and spot heights. If a question asks which two, those are the answer, not the full list of five.
3Contours
Contours are imaginary lines joining places having the same elevation above mean sea level. They are also called “level lines”. A map showing landform through contours is called a contour map.
Contours used to be drawn from ground survey and levelling. Aerial photography has now replaced those older methods, so most contours today are derived from photographs taken from the air.
3.1 Contour interval and horizontal equivalent
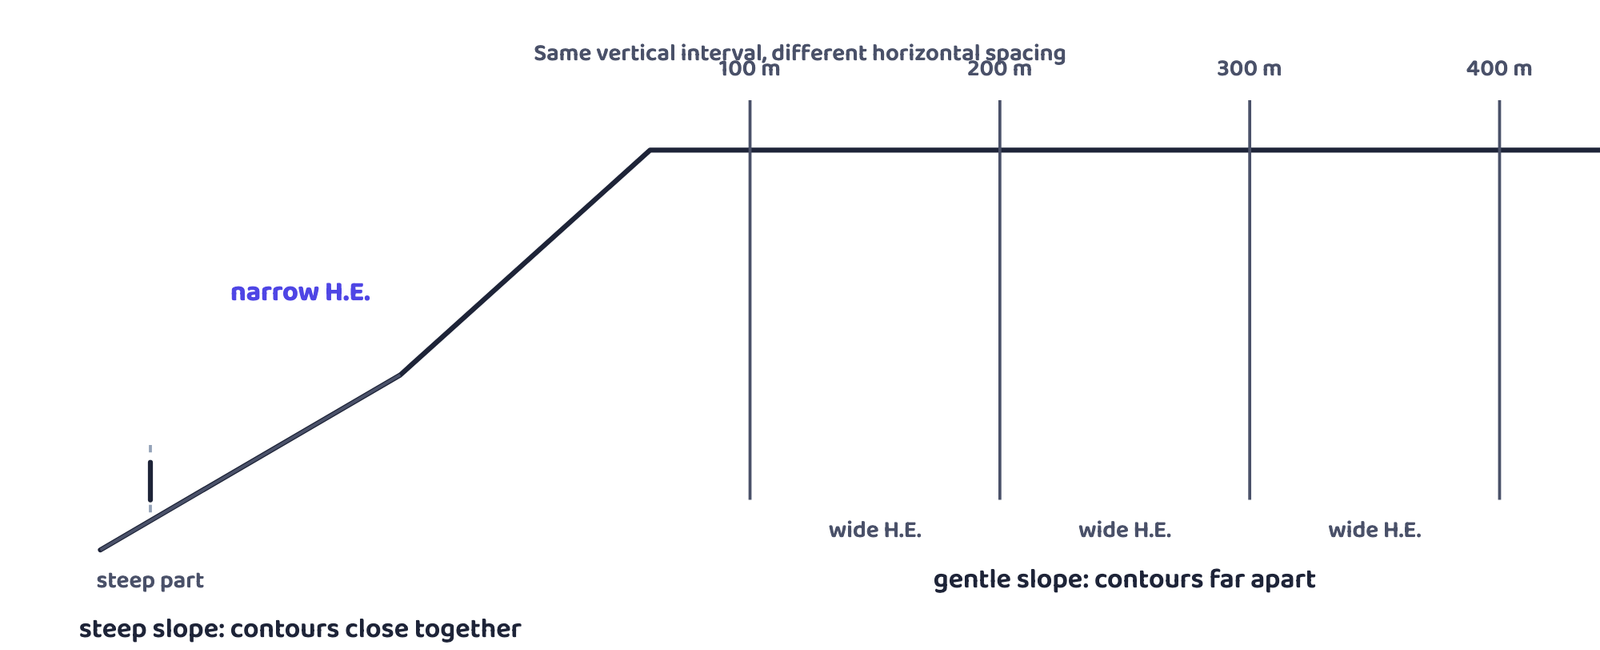
Students mix up these two. The contour interval (the vertical gap) is fixed for a whole map. The horizontal equivalent (the gap you actually see between two contour lines on paper) changes constantly because it depends on the slope at that particular spot.
3.2 Five basic features of contour lines
- A contour line joins places of equal height, never places at different heights.
- The shape and spacing of contours together show the height and the slope (gradient) of the land.
- Closely spaced contours mean a steep slope; widely spaced contours mean a gentle slope.
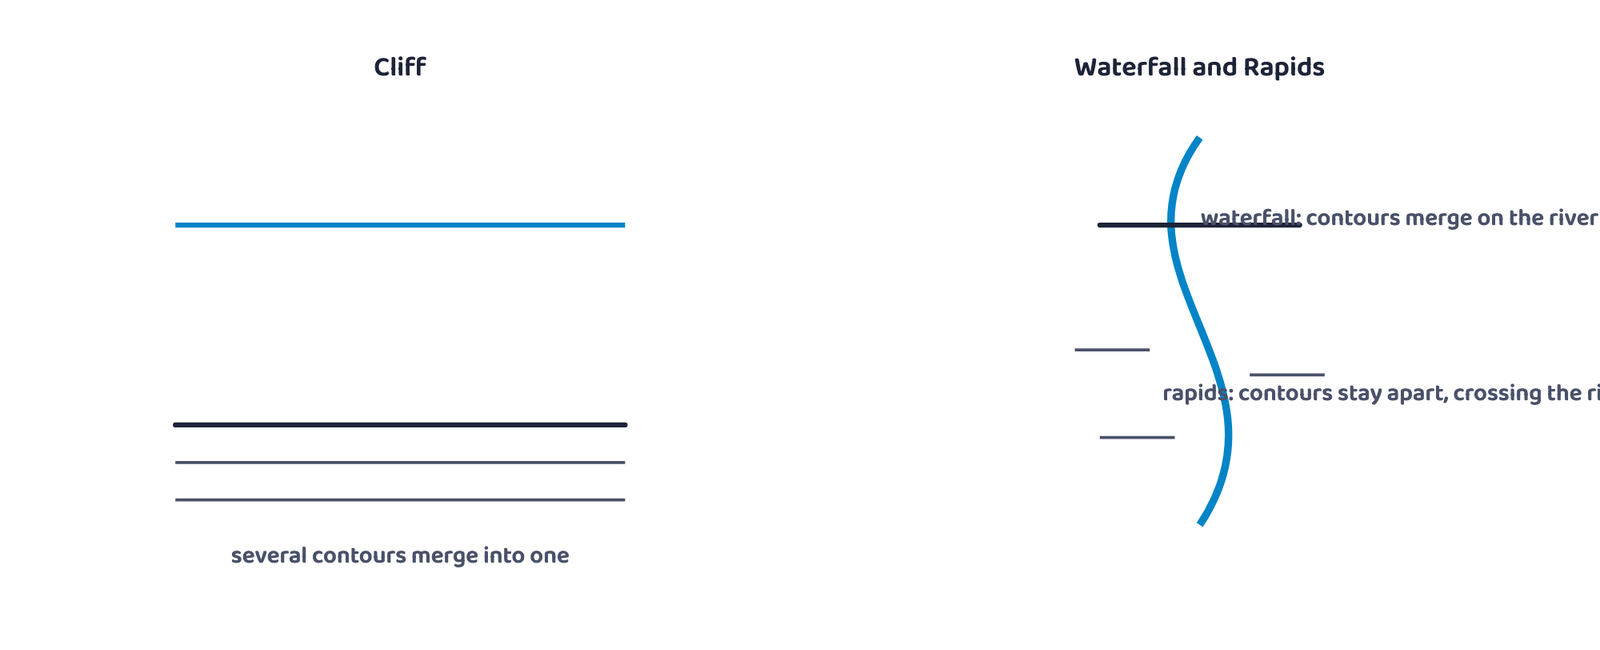
- Where two or more contours merge into one, the land is near-vertical: a cliff or a waterfall.
- Two contours of different elevation almost never cross each other.
4Types of Slope
Slope can be described by the angle it makes, but on a contour sheet it is read from spacing alone. Four types are named, and the contours of each show a distinct pattern.
4.1 Four types, told apart by contour spacing
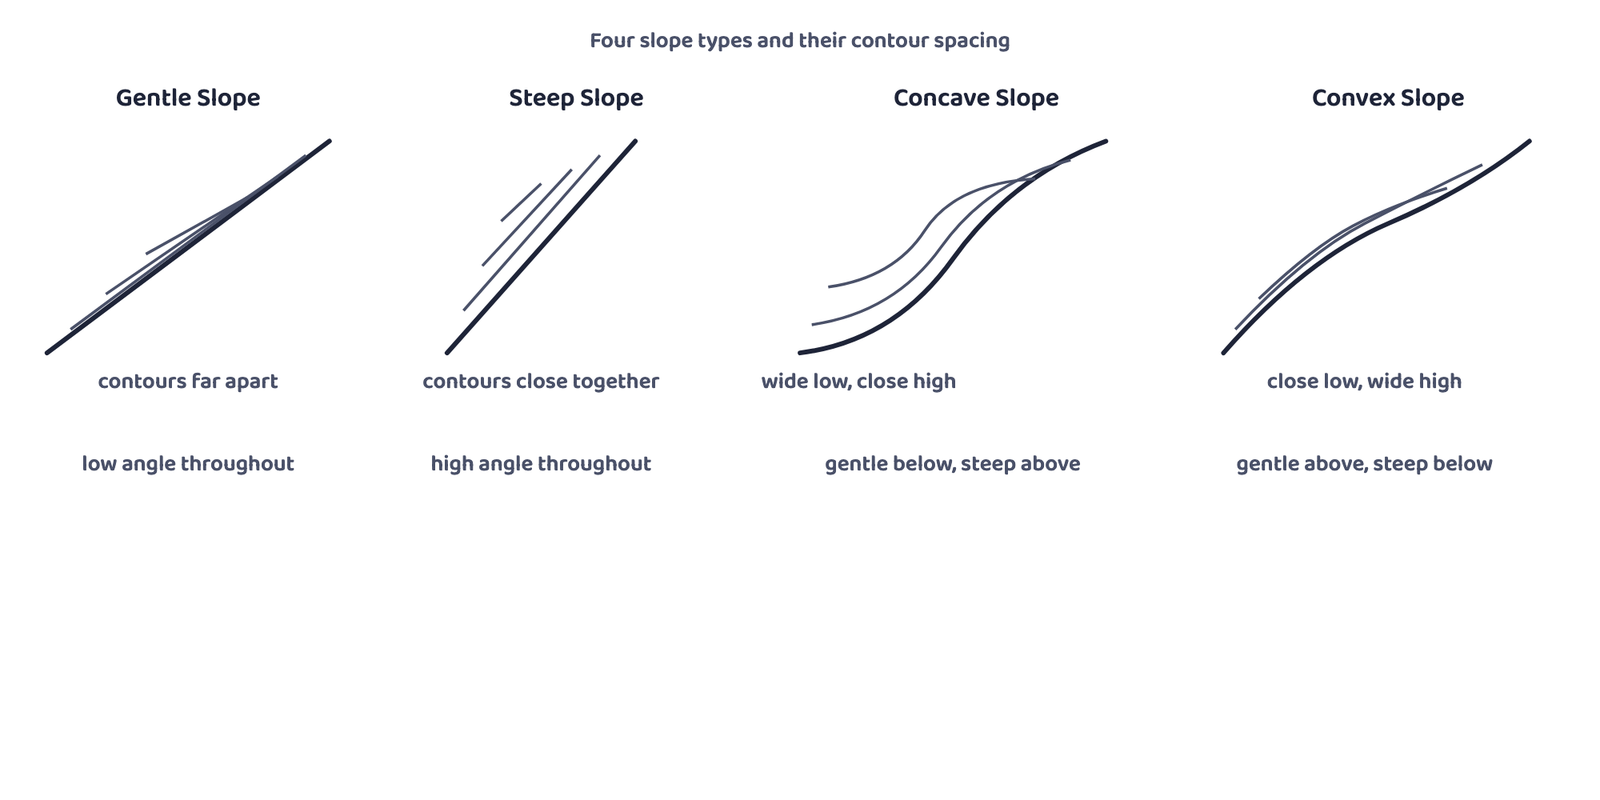
Concave Slope
- Gentle gradient in the lower part
- Steep gradient in the upper part
- Contours: widely spaced low down, closely spaced up high
Convex Slope
- Gentle gradient in the upper part
- Steep gradient in the lower part
- Contours: widely spaced up high, closely spaced low down
Concave caves in at the top: steep near the summit.
A concave slope curves inward like the inside of a cave, and the cave’s steep part is near the top. A convex slope bulges outward, like the outside of a dome, and it is steepest right at the bottom where the bulge ends.
5Landforms and Their Contour Signature
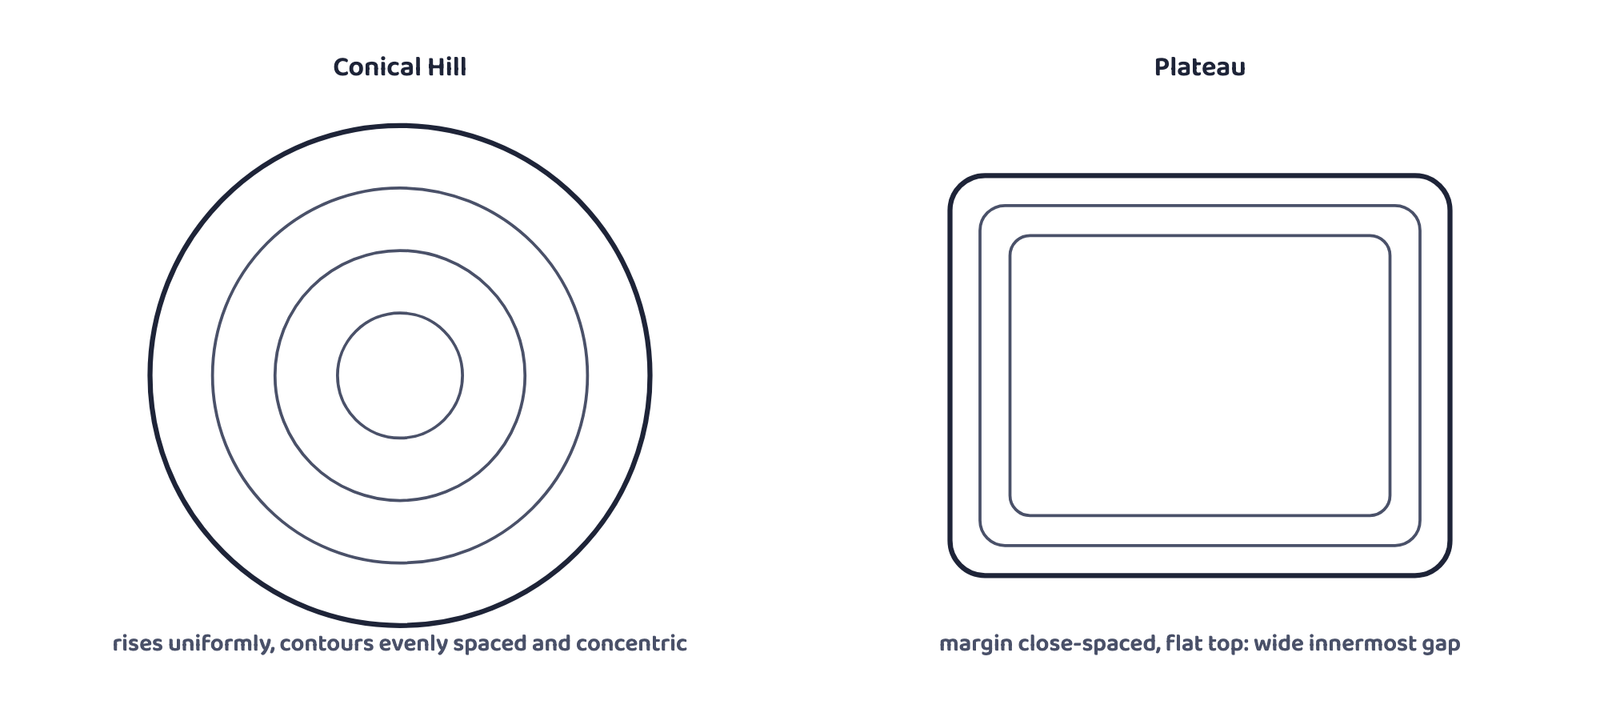
Once you can read slope from spacing, whole landforms become recognisable from their contour pattern alone. Every diagram below is a generic, invented shape used purely to teach the pattern; it is not a real hill, valley or place.
5.1 Conical hill and plateau
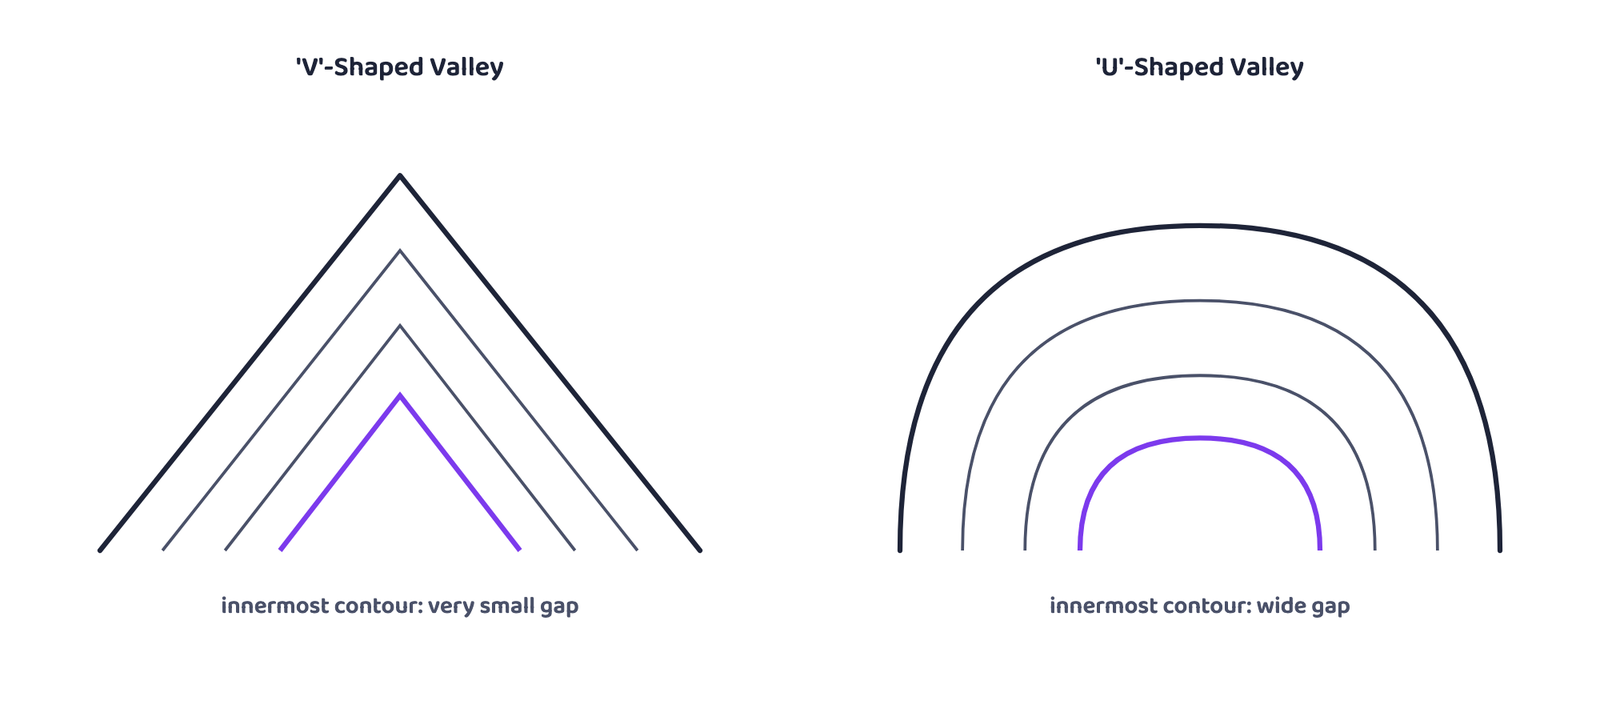
5.2 V-shaped valley and U-shaped valley
Valley is a low-lying stretch of land between two hills or ridges, formed by the lateral erosion of a river or a glacier.
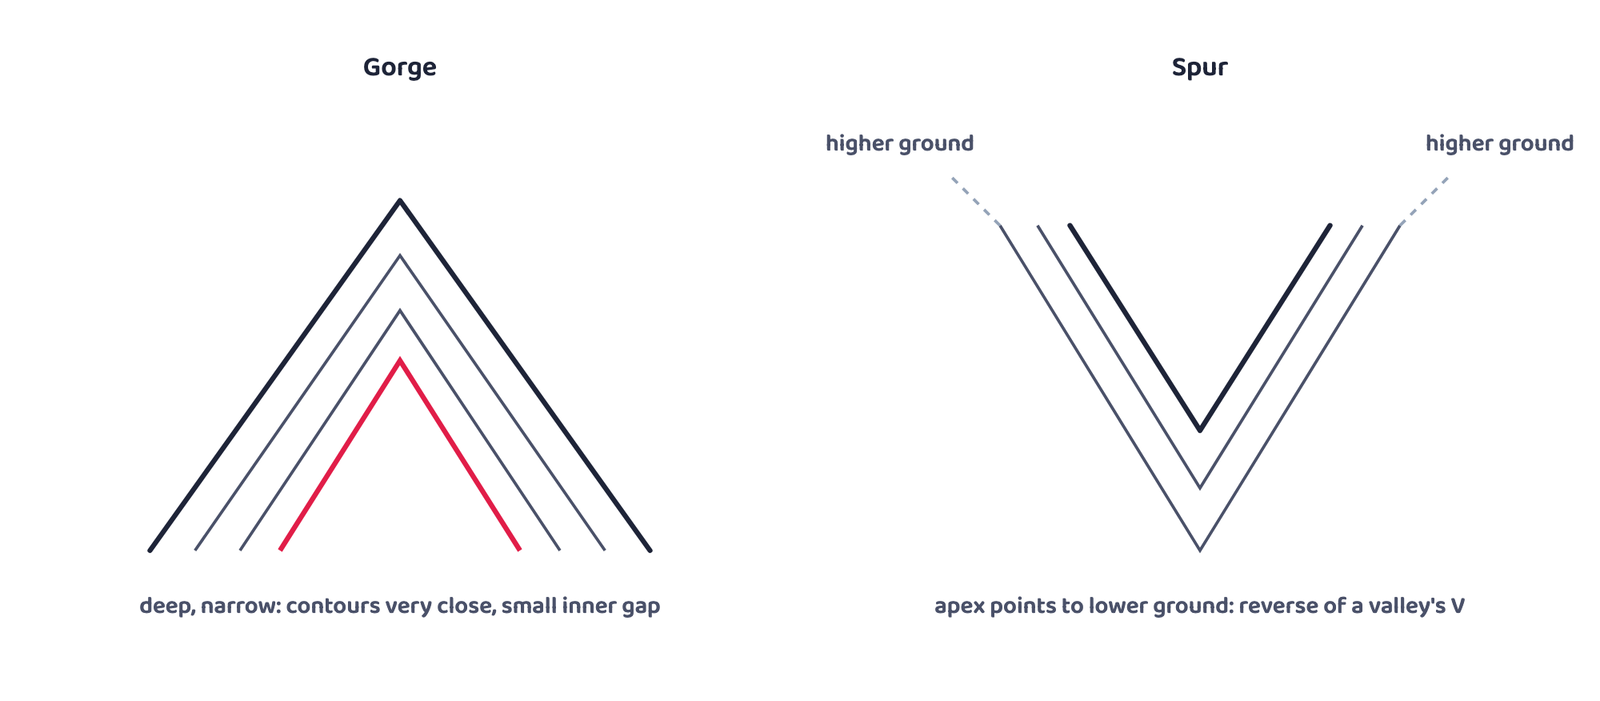
5.3 Gorge and spur
5.4 Cliff, waterfall and rapids
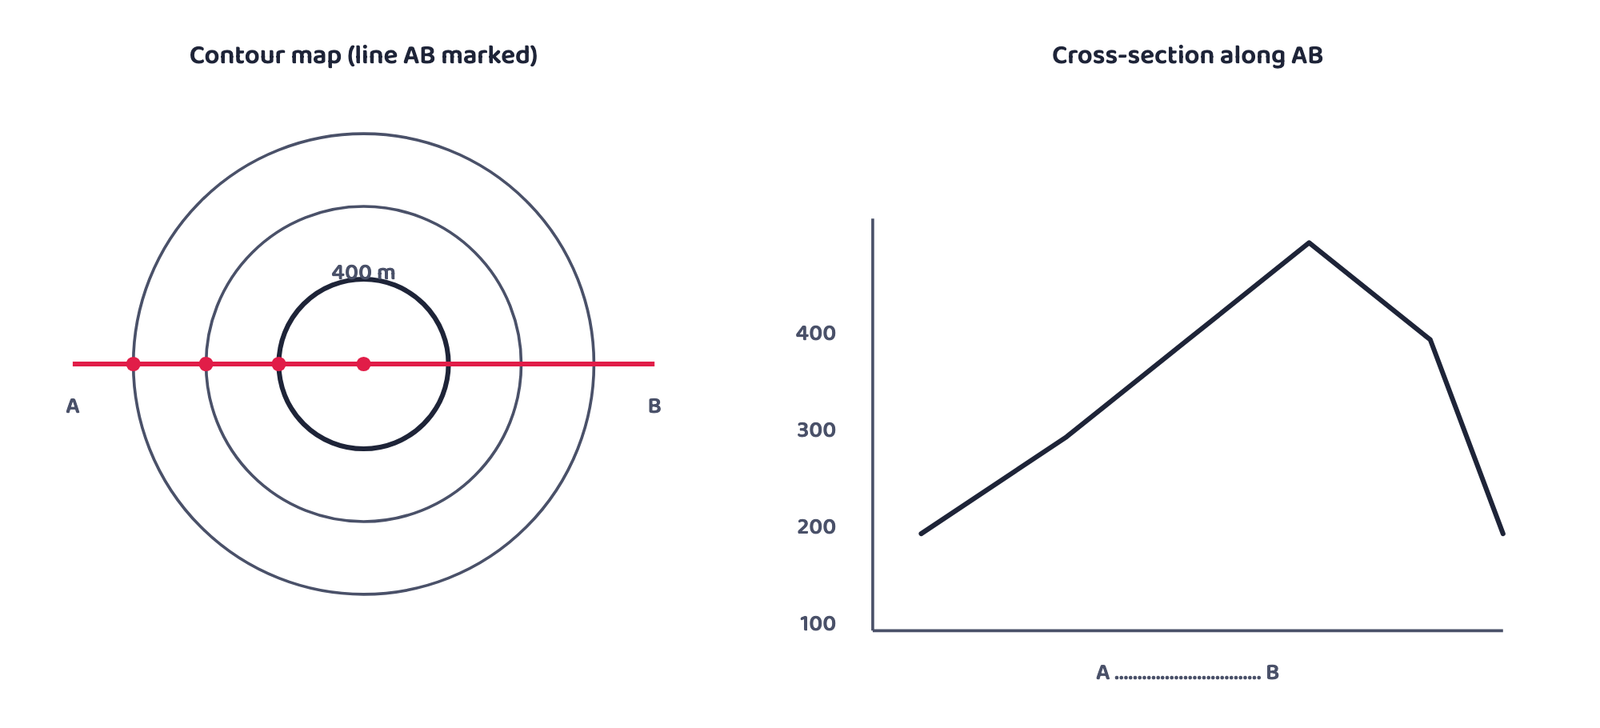
6Drawing a Cross-Section
A cross-section (also called a profile) is a side view of the ground, cut along a straight line. Turning a set of contours into a cross-section is a fixed, eight-step procedure.
Cross-section is a side view of the ground cut vertically along a straight line. It is also known as a section or a profile.
7Cultural Features on a Topographical Sheet
Settlements, buildings, roads and railways are cultural features, shown through conventional signs, symbols and colours. Where these features sit, and how they are arranged, helps explain the area shown on the map.
7.1 Distribution and types of settlement
A settlement’s pattern is read from its site, its location pattern, its alignment and its density. Comparing a settlement map with the contour map of the same area is the standard way to understand why a settlement pattern took the shape it did.
| Urban centre type | What identifies it |
|---|---|
| Cross-road town | Fan-shaped, houses along the roads, main market at the crossing |
| Nodal point | Roads radiate outward from the centre in every direction |
| Market centre | Grown around a trading point |
| Hill station | Built at height, for a cooler climate |
| Coastal resort centre | Built along a coastline |
| Port | Built for loading and unloading ships |
| Manufacturing centre | With suburban villages or satellite towns around it |
| Capital town | Seat of government |
| Religious centre | Grown around a place of worship or pilgrimage |
Five factors decide where a settlement sits: source of water, provision of food, nature of relief, nature and character of occupation, and defence. All five together, not any one alone, is the complete answer to “what determines the site of a settlement”.
Settlement density is directly related to food supply. When villages line up along a river valley, a road, an embankment or a coastline, that alignment is called a linear settlement pattern.
7.2 Transport and communication pattern
The type and density of transport and communication in an area is closely tied to its relief, its population size and how developed its resources are. These are shown through conventional signs and symbols, and reading them tells you a great deal about the area even before you look at anything else.
8Interpreting a Topographical Sheet
Interpreting a sheet needs two things: knowledge of map language, and a sense of direction. Always check the north line and the scale first, and orient yourself accordingly, before reading anything else off the sheet. A topo-sheet is then read under five standard heads.
8.1 The five heads of interpretation
Marginal Information
The sheet number, its location, grid references, its extent in degrees and minutes, its scale, and the districts it covers.
Relief and Drainage
Plains, plateaus, hills or mountains with their peaks, ridges, spurs and slope direction; rivers, tributaries, valley type and drainage pattern (dendritic, radial, ring, trellis, internal).
Land Use
Natural vegetation and forest (density; reserved, protected, classified or unclassified), agricultural land, orchards, wasteland, industrial land, and facilities such as schools, hospitals, parks and airports.
Transport and Communication
National and state highways, district roads, cart and camel tracks, footpaths, railways, waterways, and post offices.
Human Settlement
Rural (compact, semi-compact, dispersed, linear) and urban (capital, administrative, religious, port, hill-station) settlements, plus the occupation the land use and settlement pattern together suggest.
Within head 2 above, relief itself is read under four further heads: Hill (concave, convex, steep or gentle, and its shape); Plateau (broad, narrow, flat, undulating or dissected); Plain (its type: alluvial, glacial, karst, coastal, marshy); Mountain (general elevation, peaks, passes).
8.2 The map interpretation procedure
Map interpretation studies the causal relationships between the features shown on a sheet: for example, natural vegetation and cultivated land are understood against the background of landform and drainage, and settlement patterns are understood against transport networks and topography.
Aerial photographs and satellite imagery of the same area and the same scale can also be compared with a topographical map, to check and update the information it carries.
9Conventional Signs and Symbols
A topographical sheet packs an enormous amount of information into a small area using standard signs and symbols rather than words, which is exactly what lets it be read internationally. The table below groups the main categories a sheet’s own legend explains; the small sketches are generic examples of the kind of mark used for each category, not a copy of any particular published sheet.
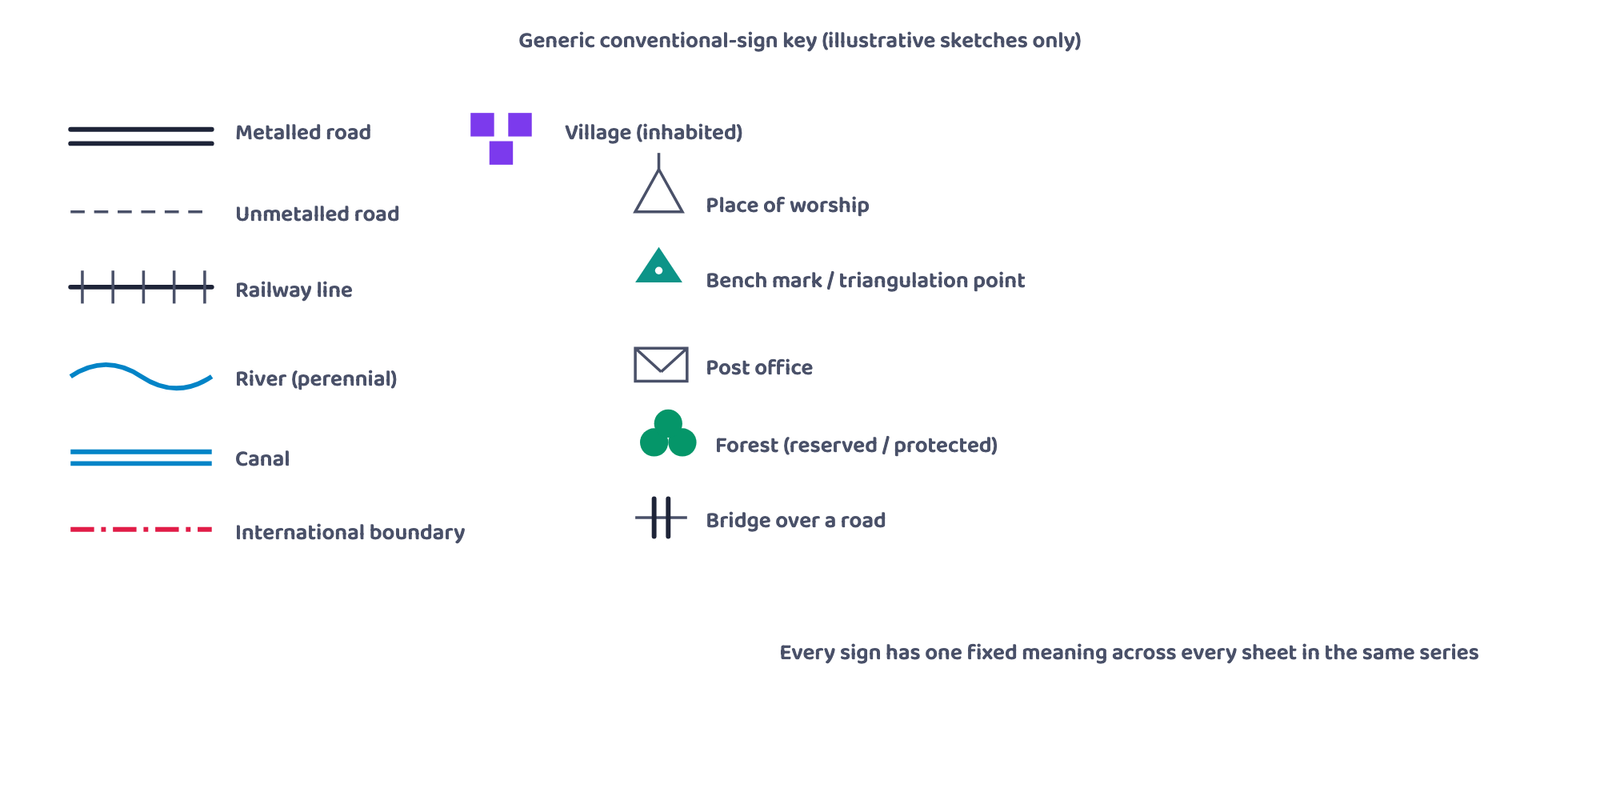
| Category | Typical features shown |
|---|---|
| Roads and tracks | Metalled road, unmetalled road, cart track, camel track, footpath, milestones, bridges |
| Water features | River (dry, perennial, with islands, tidal), canal, nala, marsh, well, tank, dam, embankment |
| Railways and wires | Broad gauge, narrow gauge, single/double line, under construction, tramway, telegraph wire, tunnel |
| Relief marks | Contours, hachured cliffs, sand dunes, spot heights, bench marks, triangulation points |
| Settlements | Inhabited village or town, deserted settlement, fort, huts, towers, ancient monuments |
| Religious and welfare | Temple, church, mosque, idgah, tomb, graveyard, lighthouse, lightship, buoy |
| Land cover | Mines, scrub, grass, forest, palm and bamboo groves, other tree cover |
| Boundaries | International, state, district, tehsil, forest boundary, boundary pillar |
| Services | Post and telegraph office, dak bungalow, rest house, circuit house, police station |
A common 5-mark question asks you to draw the conventional signs for a short list of features (international boundary, bench mark, village, metalled road, footpath with bridge, place of worship, railway line is a typical set). Practise drawing each sign small and clean; marks are given for the correct standard shape, not for artistic detail.
- A topographical map is a base map, general-purpose, large scale, prepared by the Survey of India in India
- Two series: India and Adjacent Countries Series (pre-1937 numbering, kept afterwards) and International Map Series of the World
- Five scales, largest area to smallest: 1:10,00,000 (4°x4°), 1:2,50,000 (1°x1°), 1:1,25,000 (30’x30′), 1:50,000 (15’x15′), 1:25,000 (5’x7’30”)
- Contour interval (V.I.) is constant on a map; horizontal equivalent (H.E.) varies with slope, wide on gentle slopes, narrow on steep ones
- Closely spaced contours = steep; widely spaced = gentle; merging contours = a cliff or waterfall
- Concave: gentle below, steep above. Convex: gentle above, steep below
- V-valley: very small innermost gap. U-valley: wide innermost gap. Spur: a valley’s V reversed
- Cross-section: 8 steps, from marking AB on the map to joining the plotted points into a smooth profile
- Settlement: 4 rural types (compact, scattered, linear, circular), 9 urban types, 5 site factors (water, food, relief, occupation, defence)
- Interpretation: 5 heads (marginal information, relief and drainage, land use, transport, settlement), read after orienting with the north line and scale
- 1 markIn India, topographical maps are prepared and published by:
(a) The Geological Survey of India(b) The Survey of India(c) The Indian Meteorological Department(d) The Census of India - 1 markA Survey of India sheet at scale 1 : 50,000 covers:
(a) 4° x 4°(b) 1° x 1°(c) 30′ x 30′(d) 15′ x 15′ - 1 markThe vertical gap between two successive contours is called the:
(a) Horizontal Equivalent(b) Contour Interval(c) Datum Line(d) Bench Mark - 1 markWhich of these stays constant across a given map: the contour interval or the horizontal equivalent?
(a) Contour interval only(b) Horizontal equivalent only(c) Both(d) Neither - 1 markWidely spaced contours on a map indicate:
(a) A cliff(b) A steep slope(c) A gentle slope(d) A waterfall - 1 markA concave slope has:
(a) Gentle gradient below, steep above(b) Steep gradient below, gentle above(c) A uniform gradient throughout(d) No relationship between the two parts - 1 markThe innermost contour of a ‘U’-shaped valley, compared with a ‘V’-shaped valley, has a:
(a) Smaller gap(b) Wider gap(c) Identical gap(d) No contour at all - 1 markA spur is represented on a map by contours shaped like a:
(a) Circle(b) Straight line(c) ‘V’ pointing the reverse way to a valley(d) Square - 1 markWhich of these is NOT one of the five heads under which a topographical sheet is interpreted?
(a) Marginal Information(b) Relief and Drainage(c) Population Census Data(d) Human Settlement - 1 markA village strung out along a river bank or a road is an example of which rural settlement pattern?
(a) Compact(b) Scattered(c) Linear(d) Circular
Reason (R): A contour represents one, and only one, fixed height above mean sea level, so two contours of different heights meeting at a point would mean that point had two heights at once.
Reason (R): It is the horizontal equivalent, not the contour interval, that changes with slope; the contour interval is fixed for the whole map.
Reason (R): Both form where erosion cuts a narrow, steep-sided channel, so both show closely spaced contours with a small innermost gap; a gorge is simply the more extreme case, cut mainly by vertical erosion.
- 1 markName the organisation that prepares topographical maps of India.
- 1 markDefine a contour.
- 2 marksWhat does the spacing of contours indicate about slope?
- 1 markWhat is a conventional sign?
- 2 marksName the two series in which topographical maps of India are prepared.
- 1 markWhich two methods of relief representation are used predominantly on all topographical maps?
- 2 marksDistinguish briefly between contour interval and horizontal equivalent.
- 3 marksWrite a short note on contours, covering their definition, how they are drawn today, and the contour interval.
- 3 marksWrite a short note on the “Marginal Information” given on a topographical sheet.
- 3 marksWrite a short note on the Survey of India: what it does, and the two series of maps it has prepared.
- 3 marksDistinguish between a ‘V’-shaped valley and a ‘U’-shaped valley, with reference to how their contours differ.
- 3 marksDescribe the five basic features of contour lines.
- 3 marksName and briefly explain the five factors that determine the site of a settlement.
- 5 marksExplain what is meant by “map interpretation” and describe the procedure followed to interpret a topographical sheet.
- 5 marksIf you were interpreting the cultural features shown on a topographical sheet, what information would you look for, and how would you go about finding it? Answer with suitable examples.
- 5 marksDescribe, with the help of labelled sketches, how the contour pattern differs for a conical hill, a plateau, and a gorge.
- 5 marksDescribe the eight steps used to draw a cross-section of the ground from a contour map.
- 1 markWhat is the ground distance represented by 1 cm on sheet AB-42/7?
- 1 markWhat is the general direction of flow of the river described?
- 1 markWhat rural settlement pattern do the four villages, spaced along the river’s bank, show?
- 2 marksWhich two facilities, named in the passage, would you expect to find marked with a post-office sign in each village?
- 2 marksWhat does the green patch most likely represent, and where does it sit on the sheet?