
Covers T.R. Jain & V.K. Ohri (2026-27) ch 3-6. Based on NCERT Introductory Microeconomics, Chapter 2 (Reprint 2026-27), the CBSE curriculum 2026-27 (Unit 5, 14 marks) and the CBSE Supplementary Reading Material.
Board note: CBSE teaches this book in Class 11; UP, Bihar, Rajasthan and MP Boards teach it in Class 12 Microeconomics.
- work out total and marginal utility and explain the law of diminishing marginal utility
- find the consumer’s equilibrium by utility analysis (MU = P and MUx/Px = MUy/Py)
- explain the indifference curve, MRS, the indifference map and the features of indifference curves
- write the budget set and budget line, its equation and slope, and show how it moves when income or a price changes
- locate the consumer’s optimum at the point of tangency (MRS = p1/p2)
- explain demand, the law of demand, derivation of the demand curve, movement and shift, and market demand
- measure price elasticity of demand by the percentage method, on a linear curve and by the total expenditure method
1 The problem of choice and basic notation
- Every consumer has to decide how to spend her income on different goods; economists call this the problem of choice
- She wants the combination that gives her maximum satisfaction; this ‘best’ combination depends on two things:
- the consumer’s likes, also called preferences
- what she can afford, which depends on the prices of the goods and her income
- Two approaches explain consumer behaviour: (i) Cardinal Utility Analysis and (ii) Ordinal Utility Analysis
- In the book, “goods” means goods as well as services
Preliminary notations and assumptions
- For simplicity there are only two goods: bananas and mangoes; this lets simple diagrams explain the ideas
- Any combination of amounts of the two goods is a consumption bundle, or simply a bundle
- = quantity of bananas, = quantity of mangoes; both can be positive or zero
- is the bundle with bananas and mangoes. So (5, 10) has 5 bananas and 10 mangoes, while (10, 5) has 10 bananas and 5 mangoes
2 Utility
Utility of a commodity is its want-satisfying capacity. The stronger the need for a commodity or the desire to have it, the greater the utility derived from it.
Subjective
Different people get different utility from the same commodity. Someone who likes chocolates gets much higher utility from a chocolate
Changes with place
The utility of a room heater depends on whether the person is in Ladakh or in Chennai
Changes with time
The same room heater is more useful in winter than in summer
3 Cardinal utility analysis
Cardinal utility analysis assumes that the level of utility can be expressed in numbers. For example: “this shirt gives me 50 units of utility”.
3.1 Two measures of utility
Total utility (TU) of a fixed quantity of a commodity is the total satisfaction derived from consuming that amount of commodity x. More of x gives more satisfaction, so TU depends on the quantity consumed. = total utility from n units of x.
Marginal utility (MU) is the change in total utility due to the consumption of one additional unit of a commodity:
- 4 bananas give 28 units of total utility and 5 bananas give 30 units
- The 5th banana raised total utility by 2 units:
3.2 Table 2.1 and the law of diminishing marginal utility
| Units | Total utility (TU) | Marginal utility (MU) | What is happening |
|---|---|---|---|
| 1 | 12 | 12 | TU rises, but at a diminishing rate; MU falls |
| 2 | 18 | 18 − 12 = 6 | |
| 3 | 22 | 22 − 18 = 4 | |
| 4 | 24 | 24 − 22 = 2 | |
| 5 | 24 | 24 − 24 = 0 | TU at its maximum (constant), MU zero |
| 6 | 22 | 22 − 24 = −2 | TU starts falling, MU negative |
The book’s Table 2.1 (an imaginary example). MU diminishes from 12 to 6, 6 to 4 and so on.

Law of Diminishing Marginal Utility: marginal utility from consuming each additional unit of a commodity declines as its consumption increases, while keeping consumption of other commodities constant.
- Reason: having obtained some amount of the commodity, the consumer’s desire to have still more of it becomes weaker
- MU becomes zero at the level where TU remains constant (the 5th unit in the table)
- After that TU starts falling and MU becomes negative
| Position of MU | Behaviour of TU |
|---|---|
| MU positive but falling | TU rises at a diminishing rate |
| MU = 0 | TU at its maximum (highest point) |
| MU negative | TU falls |
Q. Total utility from 1 to 6 units of a good is 4, 7, 9, 10, 10, 9. Find marginal utility and name the law it shows.
- Formula: (½)
- MU: 4 (= 4 − 0), 3 (= 7 − 4), 2 (= 9 − 7), 1 (= 10 − 9), 0 (= 10 − 10), −1 (= 9 − 10) (1)
- Each further unit’s MU is lower than the previous one: law of diminishing marginal utility (½)
- Meaning: TU is highest (10) at the 5th unit because MU = 0 there; the 6th unit reduces satisfaction
- MU of the first unit equals TU of the first unit (here ); leaving it blank is wrong
- “TU is maximum when MU is maximum” is wrong; TU is maximum when MU = 0
- MU can be negative while TU is still positive (6th unit in the table: TU 22, MU −2)
3.3 Derivation of the demand curve for a single commodity
Demand: the quantity of a commodity that a consumer is willing to buy and is able to afford, given the prices of goods and the income of the consumer, is called demand for that commodity.
- Demand for commodity x depends, apart from its own price, on the prices of other commodities (substitutes and complements), the income of the consumer and her tastes and preferences
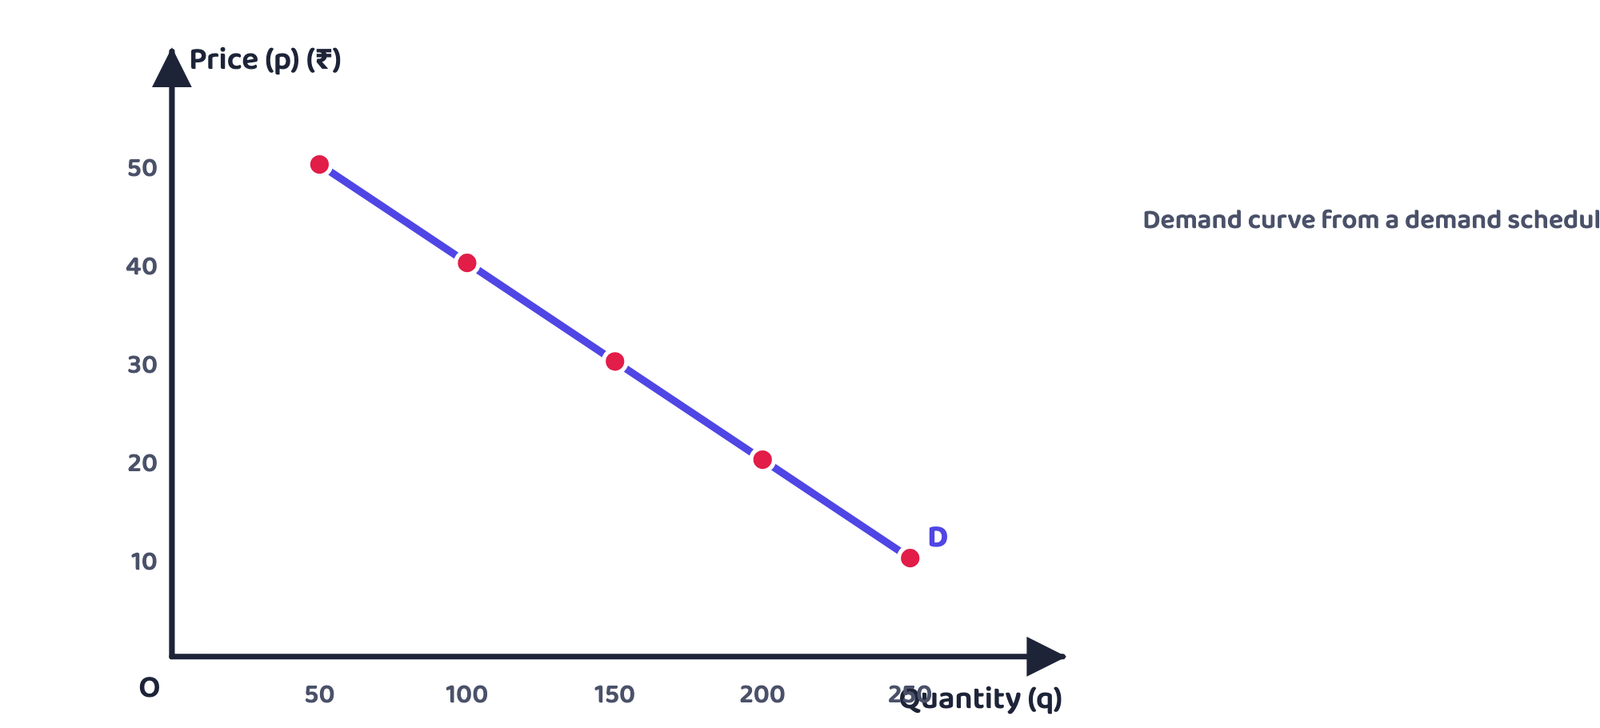
- The demand curve is a graph of the quantities a consumer is willing to buy at different prices of the commodity, holding constant the prices of related commodities and income
- Quantity is measured on the horizontal axis and price on the vertical axis; the curve slopes downward: more is bought at lower prices, less at higher prices
- This negative relationship between price and quantity demanded is the Law of Demand
3.4 Consumer’s equilibrium by utility analysis
This part is in the CBSE curriculum 2026-27 (“conditions of consumer’s equilibrium using marginal utility analysis”) and is taken from the CBSE Supplementary Reading Material; the rationalised NCERT text does not give it separately.
Consumer’s equilibrium is the situation in which the consumer, with given income and prices, spends in such a way that she gets maximum satisfaction and has no reason to change her spending.
(a) One good: MU = P
- Take utility as measured in rupees; the consumer compares the MU of each unit with its price (P)
- While MU > P, buying a unit pays (she gets more than she gives); as she buys more, MU falls
- She stops where MU = P; beyond that MU < P and the next unit is a losing bargain
| Unit | Price (₹) | MU (₹) | Decision |
|---|---|---|---|
| 1 | 3 | 8 | MU > P, buy |
| 2 | 3 | 7 | MU > P, buy |
| 3 | 3 | 5 | MU > P, buy |
| 4 | 3 | 3 | MU = P, equilibrium |
| 5 | 3 | 2 | MU < P, will not buy |
Example from the CBSE Supplementary Reading Material: the consumer maximises satisfaction by buying 4 units.

(b) Two goods: equi-marginal utility
The consumer buys two goods X and Y with given income and prices , . There are two conditions of equilibrium:
- Suppose : a rupee spent on X gives more utility than a rupee spent on Y
- The consumer moves a rupee from Y to X: she gains more utility than she loses
- Buying more X lowers , buying less Y raises ; this goes on until the two ratios are equal
- Without condition 2 (MU not falling) the ratios might never be equal and the consumer would end up buying just one good
Q. Income ₹15, = ₹2, = ₹3. MU of the first 5 units of X: 20, 16, 12, 8, 4; of Y: 30, 24, 18, 12, 6. Find the equilibrium bundle.
| Unit | MUx | MUx/Px | MUy | MUy/Py |
|---|---|---|---|---|
| 1 | 20 | 10 | 30 | 10 |
| 2 | 16 | 8 | 24 | 8 |
| 3 | 12 | 6 | 18 | 6 |
| 4 | 8 | 4 | 12 | 4 |
| 5 | 4 | 2 | 6 | 2 |
- Condition: with the whole income spent (½)
- At 3 units of X and 3 units of Y both ratios are 6; spending = 2 × 3 + 3 × 3 = ₹15 = income (1)
- Equilibrium bundle: X = 3, Y = 3; total utility = (20 + 16 + 12) + (30 + 24 + 18) = 120 (½)
- Meaning: the last rupee on each good gives the same utility (6); no other bundle costing ₹15 gives more than 120
- In equilibrium . If falls,
- The consumer buys more X and less Y until falls and the ratios are equal again
- With one good too: if price falls, MU > P, so she buys more units
- Either way, when price falls, demand rises: the law of demand
4 Ordinal utility analysis
- Cardinal analysis is simple to understand but has a major drawback: quantification of utility in numbers
- In real life we never express utility in numbers; at most we rank combinations as having more or less utility
- The consumer does not measure utility but she ranks bundles; this is the starting point of ordinal utility analysis
Ordinal utility analysis does not measure utility in numbers; it only ranks bundles in order of more or less satisfaction.
4.1 Indifference curve
An indifference curve (IC) joins all points representing bundles among which the consumer is indifferent, that is, bundles that give her equal satisfaction.
- All points such as A, B, C and D on an indifference curve give the same level of satisfaction
- To get one more banana and stay on the same curve (same satisfaction), the consumer must give up some mangoes; so the curve slopes downward
The marginal rate of substitution (MRS) is the amount of mangoes the consumer has to forego to get an additional banana, her total utility being the same. It is the rate at which she substitutes bananas for mangoes:
- MRS is only the magnitude (absolute value) of : if , MRS = 3
| Combination | Quantity of bananas (Qx) | Quantity of mangoes (Qy) | MRS |
|---|---|---|---|
| A | 1 | 15 | – |
| B | 2 | 12 | 3 : 1 |
| C | 3 | 10 | 2 : 1 |
| D | 4 | 9 | 1 : 1 |
The book’s Table 2.2: representation of the law of diminishing marginal rate of substitution.

Law of Diminishing Marginal Rate of Substitution: as the quantity of bananas increases, the quantity of mangoes sacrificed for each additional banana (MRS) declines.
- A to B: 3 mangoes for 1 banana; B to C: 2 mangoes; C to D: just 1 mango
- Reason: as bananas increase, the MU from each additional banana falls; as mangoes fall, the MU of mangoes rises; so the consumer is inclined to sacrifice smaller and smaller amounts of mangoes
4.2 Shape of an indifference curve
- The law of diminishing MRS makes an indifference curve convex to the origin; this is the most common shape
- For perfect substitutes the MRS does not diminish; it stays constant, so the indifference curve is a straight line
Perfect substitutes are goods that can be used in place of each other and give exactly the same level of utility to the consumer.
| Combination | Five-rupee notes | Five-rupee coins | MRS |
|---|---|---|---|
| A | 1 | 8 | – |
| B | 2 | 7 | 1 : 1 |
| C | 3 | 6 | 1 : 1 |
| D | 4 | 5 | 1 : 1 |
The book’s Table 2.3. As long as the total of notes and coins stays the same (9), the consumer is indifferent; a ₹5 coin and a ₹5 note are the same to her.

4.3 Monotonic preferences
Monotonic preferences: between any two bundles and , if has more of at least one good and no less of the other, the consumer prefers . Preferences of this kind are called monotonic.
- (10, 8) vs (8, 6): the first has more of both goods, so a consumer with monotonic preferences prefers (10, 8); she cannot be indifferent between them
- (6, 6) vs (5, 6): the first has more bananas and the same mangoes; a monotonic consumer chooses (6, 6)
4.4 Indifference map
An indifference map is a family of indifference curves representing the consumer’s preferences over all bundles. Monotonicity means that between any two curves the bundles on the higher one are preferred to those on the lower one.

4.5 Features of indifference curves
The book lists three features (1-3); the fourth point, convexity, comes from section 4.2 “Shape of an indifference curve”.
Slopes downward from left to right
More bananas mean giving up some mangoes. If no mangoes were given up, the consumer would have more bananas and the same mangoes and be on a higher curve. So on the same curve: means
Higher curve, higher utility
As long as MU is positive, more of a good gives more satisfaction. Combinations with more mangoes, more bananas or more of both lie on higher curves
Two curves never intersect
Intersecting curves would lead to conflicting results
Shape: convex to the origin
See section 4.2
Proof of feature 2: Table 2.4
| Combination | Quantity of bananas | Quantity of mangoes |
|---|---|---|
| A | 1 | 10 |
| B | 2 | 10 |
| C | 3 | 10 |
- All three have the same mangoes (10); B has more bananas than A, so B gives more satisfaction and lies on a higher curve
- C has more bananas than B, so C lies on a curve higher still (in the figure above A, B and C lie on IC₁, IC₂ and IC₃)
Proof of feature 3: Figure 2.8 of the book

| Basis | Cardinal utility | Ordinal utility |
|---|---|---|
| Measurement | In numbers (50 units) | Only ranking (more/less) |
| Main tools | TU, MU, diminishing MU | Indifference curves, MRS, budget line |
| Equilibrium condition | MUx/Px = MUy/Py | MRS = Px/Py, IC convex |
| Merit/drawback | Simple, but counting utility is unrealistic | More realistic; needs only ranking |
The book’s summary says that, besides an indifference map, a consumer’s preferences can also be represented by a utility function. A utility function gives each bundle a number such that a preferred bundle gets a larger number; all bundles on one indifference curve get the same number.
5 The consumer’s budget
- The consumer has a fixed income to spend on two goods, and the prices are given in the market
- She cannot buy every combination she wants; only bundles that cost less than or equal to her income
5.1 Budget set and budget line
- Income = M; prices of bananas and mangoes = and
- The price of a good is the amount of money the consumer has to pay per unit of the good she wants to buy (a banana price of means rupees per kilogram)
- Spending on bananas is , on mangoes ; the bundle costs
Budget constraint: the consumer can buy any bundle such that …(2.1). This inequality is the consumer’s budget constraint.
The budget set is the collection of all bundles that the consumer can buy with her income at the prevailing market prices.
- Income ₹20; both goods priced at ₹5; available only in whole units; condition , that is
- The 15 affordable bundles: (0,0), (0,1), (0,2), (0,3), (0,4), (1,0), (1,1), (1,2), (1,3), (2,0), (2,1), (2,2), (3,0), (3,1), (4,0)
- Of these, 5 cost exactly ₹20: (0,4), (1,3), (2,2), (3,1), (4,0); the other 10 cost less than ₹20
- (3,3) costs ₹30 and (4,5) costs ₹45; these exceed ₹20 and cannot be bought

- If the goods are perfectly divisible (you can buy half a kilogram of rice or one-fourth of a litre of milk, but not half an orange or one-fourth of a banana), the budget set is every point in the positive quadrant on or below the line
The budget line consists of all bundles that cost exactly M (the whole income): …(2.2). Points below the budget line are bundles that cost strictly less than M.
5.2 Price ratio and the slope of the budget line
- Every point on the budget line uses up the whole budget; one more banana is possible only by giving up some of the other good
- A banana costs , so spending on mangoes must fall by ; with she could buy mangoes
- So one extra banana costs mangoes: in the market she can substitute bananas for mangoes at the rate
- The absolute value of the budget line’s slope is the rate at which she is able to substitute bananas for mangoes while spending her whole budget (the absolute value is x if x ≥ 0 and −x if x < 0)
Derivation of the slope of the budget line
Q. Income ₹60, price of bananas ₹5, price of mangoes ₹3. Write the budget line, both intercepts and the slope.
Given
M = 60, = 5, = 3
To find
equation, intercepts, slope
- Equation: (1)
- Whole income on bananas: 12 bananas; on mangoes: 20 mangoes (1)
- Slope −5/3 (1)
- Meaning: spending the whole budget, one more banana costs 5/3 (about 1.67) mangoes
5.3 Changes in the budget set
(a) A change in income (prices constant)
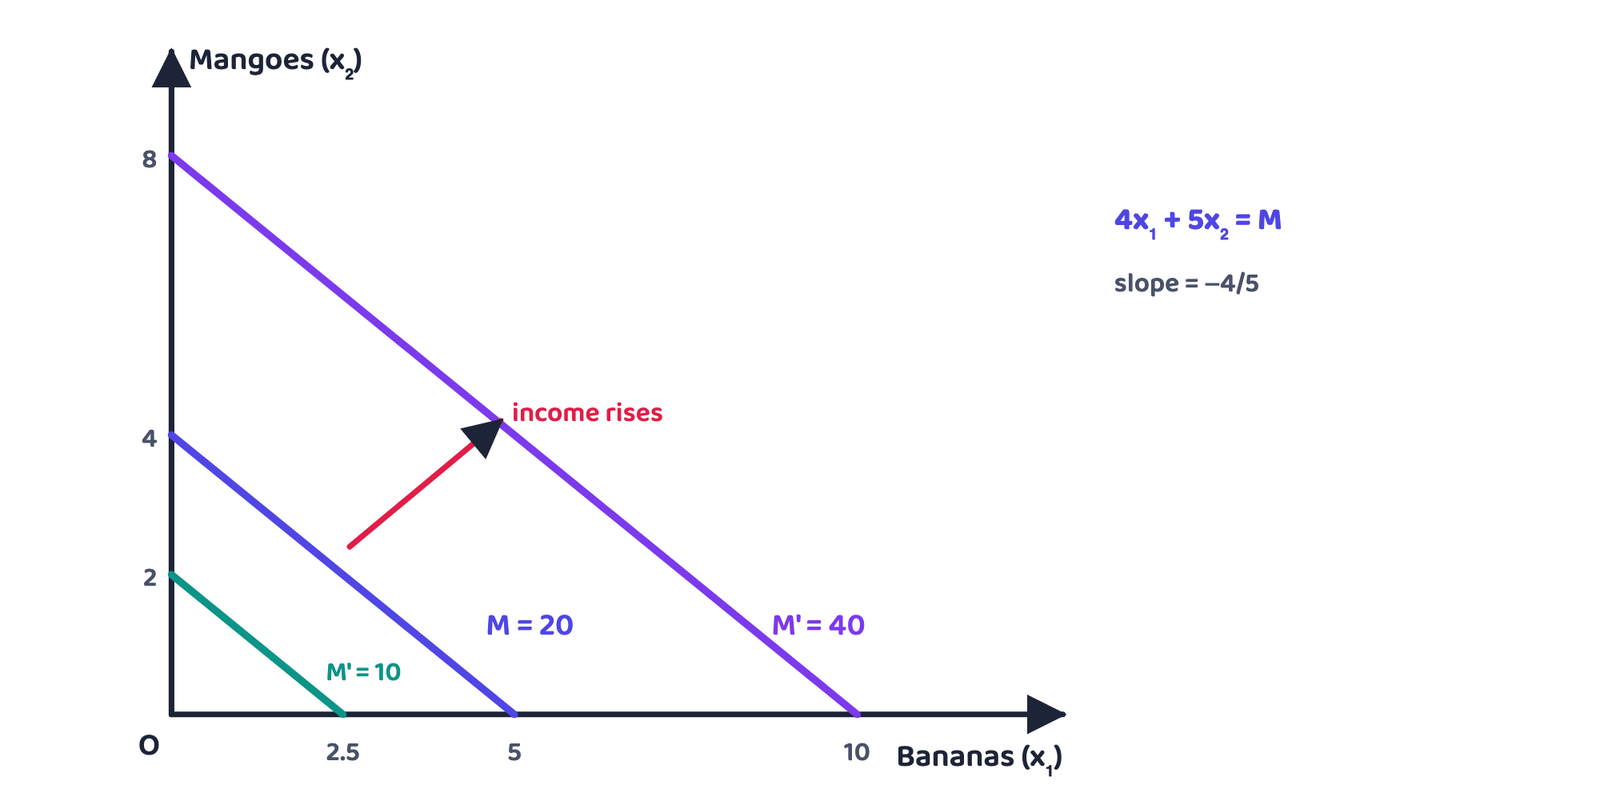
- Income changes from M to M′: new line …(2.8), that is …(2.9)
- The slope is unchanged () but the intercepts change
- M′ > M: both intercepts rise, a parallel outward shift of the budget line; she can buy more of the goods
- M′ < M: both intercepts fall, a parallel inward shift; availability of goods goes down
(b) A change in the price of one good (income and the other price constant)
- Price of bananas changes from to : …(2.10), that is …(2.11)
- The vertical intercept is unchanged (); the slope and horizontal intercept change
- : the absolute slope rises, the line becomes steeper (it pivots inwards around the vertical intercept and the horizontal intercept falls)
- : the line becomes flatter (it pivots outwards and the horizontal intercept rises)
- A change in the price of mangoes works the same way, but now the horizontal intercept stays and the line pivots around it

| Change | Slope | What stays fixed | Behaviour of the line |
|---|---|---|---|
| Income rises | Same | Prices | Parallel outward |
| Income falls | Same | Prices | Parallel inward |
| rises | Steeper | Vertical intercept | Horizontal intercept moves in |
| falls | Flatter | Vertical intercept | Horizontal intercept moves out |
| falls | Flatter | Horizontal intercept | Vertical intercept moves up |
| Income and both prices double | Same | All ratios | No change |
- Writing the slope as is wrong; the price of the good on the horizontal axis (good 1) goes on top:
- Writing the horizontal intercept as is wrong; good 1 is on the horizontal axis, so it is
- When income changes the line does not “pivot”; it shifts parallel. Pivoting happens when a price changes
| Basis | Budget set | Budget line |
|---|---|---|
| Meaning | All affordable bundles | Only bundles that use up the whole income |
| Condition | ||
| In the diagram | The whole area on and below the line | Only the line |
6 Optimal choice of the consumer
- The consumer chooses from the budget set on the basis of her tastes and preferences; her preferences are well defined: between any two bundles she either prefers one or is indifferent
A rational consumer clearly knows what is good or bad for her and in any situation always tries to achieve the best for herself. From the bundles available to her she always chooses the one that gives her maximum satisfaction.
- The consumer’s problem: to move to a point on the highest possible indifference curve given her budget set
6.1 Why the optimum lies on the budget line
6.2 Tangency: MRS = price ratio
- The optimum on the budget line is where the budget line just touches (is tangent to) one of the indifference curves
- Any other point on the budget line lies on a lower indifference curve and is inferior
- At the point of tangency the absolute slope of the indifference curve (MRS) equals the absolute slope of the budget line (price ratio )
- MRS is the rate at which the consumer is willing to substitute; the price ratio is the rate at which she is able to substitute in the market; at the optimum the two are equal

- The curve that just touches the budget line (IC₂) is the highest curve the budget set allows; bundles on higher curves (IC₃) are not affordable; bundles on lower curves (IC₁) are certainly inferior
- In the figure the budget line is ; at E, , and spending is ; MRS there is 4/5 = 0.8
- Suppose at some point MRS = 2 and the two goods have the same price ()
- The consumer is willing to give up 2 mangoes for an extra banana, but in the market she gets a banana for just 1 mango
- By buying an extra banana she can have more of both goods than before and move to a preferred bundle; so a point with MRS > price ratio is not the optimum
- A similar argument holds where MRS < price ratio: she would buy fewer bananas and more mangoes
The book’s footnote 9: in some situations the optimum can be at a point where the consumer spends her entire income on one of the goods only.
7 Demand
- The amount of a good the consumer chooses optimally depends on: the price of the good itself, the prices of other goods, the consumer’s income and her tastes and preferences (these are the determinants of demand)
- If any of these changes, the chosen quantity is likely to change; so we change one variable at a time
7.1 Demand function, demand schedule and demand curve
Demand function: if the prices of other goods, income and tastes stay unchanged, the amount of a good the consumer optimally chooses depends entirely on its price. This relation is the demand function: …(2.12), where X is the quantity and P the price.
- A function is a relation between x and y such that for each value of x there is a unique value of y; x is the independent variable, y the dependent variable
- Example 1: x = 0, 1, 2, 3 with y = 10, 15, 18, 20; algebraic examples: and
- Increasing function: y does not decrease as x rises (, graph slopes upward); decreasing function: y does not increase as x rises (, graph slopes downward)
- Usually the independent variable goes on the horizontal axis, but in the demand curve it is the opposite: the independent variable (price) is on the vertical axis and the dependent variable (quantity) on the horizontal axis
A demand schedule is a table showing the different quantities of a good that buyers are willing to buy at different prices during a given period. The demand curve is the graphical representation of the demand function (or schedule).
| Price (₹ per unit) | 50 | 40 | 30 | 20 | 10 |
|---|---|---|---|---|---|
| Quantity demanded (units) | 50 | 100 | 150 | 200 | 250 |
Demand schedule from the CBSE Supplementary Reading Material: more is purchased as price falls.
7.2 Deriving a demand curve from indifference curves and budget constraints
- Income M, price of bananas and of mangoes ; she is in equilibrium at C, buying bananas; (, ) is the first point on the demand curve
- The price of bananas drops to ( and M constant): the budget set expands and the new equilibrium is at D on a higher indifference curve, with more bananas (); this is the second point
- Dropping the price further raises bananas again; the third point. Joining the points gives a negatively sloped demand curve

Why the demand curve slopes downward: two effects
Substitution effect
- When bananas become cheaper the consumer substitutes bananas for mangoes
- She maximises utility, deriving the same level of satisfaction
- Demand for bananas rises
Income effect
- When bananas become cheaper her purchasing power (real income) rises
- This further raises demand for bananas (and mangoes)
- For a normal good both effects work in the same direction
Law of Demand: other things being equal, there is a negative relation between demand for a commodity and its price. When the price increases, demand falls; when the price decreases, demand rises, other factors remaining the same.
7.3 Linear demand
7.4 Normal and inferior goods
Normal goods: goods whose demand moves in the same direction as the consumer’s income: demand rises when income rises and falls when income falls. Most goods are like this.
Inferior goods: goods whose demand moves in the opposite direction to income: demand falls when income rises and rises when income falls. Examples: low quality food items such as coarse cereals.
- A good can be normal at some levels of income and inferior at others
- At very low incomes demand for low quality cereals rises with income; beyond a level, more income reduces it as the consumer switches to better quality cereals
- Sometimes a rise in purchasing power (income) makes the consumer reduce consumption of a good; then the substitution effect and the income effect work in opposite directions
- If the substitution effect is stronger, demand and price are still inversely related
- If the income effect is stronger than the substitution effect, demand is positively related to price; such a good is a Giffen good (an exception to the law of demand)
7.5 Substitutes and complements
Complementary goods are consumed together, for example tea and sugar, shoes and socks, pen and ink. Demand for a good moves in the opposite direction to the price of its complementary goods.
Substitutes are used in place of each other, not together, for example tea and coffee. Demand for a good usually moves in the same direction as the price of its substitutes.
| Basis | Complements (tea-sugar) | Substitutes (tea-coffee) |
|---|---|---|
| Use | Together | One in place of the other |
| Price of related good rises | Sugar dearer: demand for tea falls | Coffee dearer: demand for tea rises |
| Price of related good falls | Sugar cheaper: demand for tea rises | Coffee cheaper: demand for tea falls |
| Direction | Opposite | Same |
7.6 Shifts in and movements along the demand curve
| Change in factor | Demand curve |
|---|---|
| Income rises, normal good | Shifts rightward |
| Income rises, inferior good | Shifts leftward |
| Price of a substitute rises | Shifts rightward |
| Price of a complement rises | Shifts leftward |
| Preference changes in favour (ice-creams in summer) | Shifts rightward |
| Unfavourable change (revelation that cold-drinks might be injurious to health) | Shifts leftward |
| The good’s own price changes | No shift; movement along the same curve |

Movement along the demand curve
- Cause: only a change in the good’s own price
- From one point to another on the same curve
- Price falls: extension of demand (downward movement); price rises: contraction (upward movement)
- Also called a “change in quantity demanded”
Shift of the demand curve
- Cause: a factor other than price (income, price of a related good, tastes)
- A whole new curve
- Rightward: increase in demand (more at every price); leftward: decrease in demand
- Also called a “change in demand”
- “A fall in the good’s own price shifts the demand curve right” is wrong; a change in own price gives a movement along the curve, not a shift
- A rise in income does not shift every curve right; an inferior good’s curve shifts left
- When a complement (sugar) gets dearer, tea’s curve shifts left, not right
8 Market demand
Market demand for a good at a particular price is the total demand of all consumers taken together at that price.
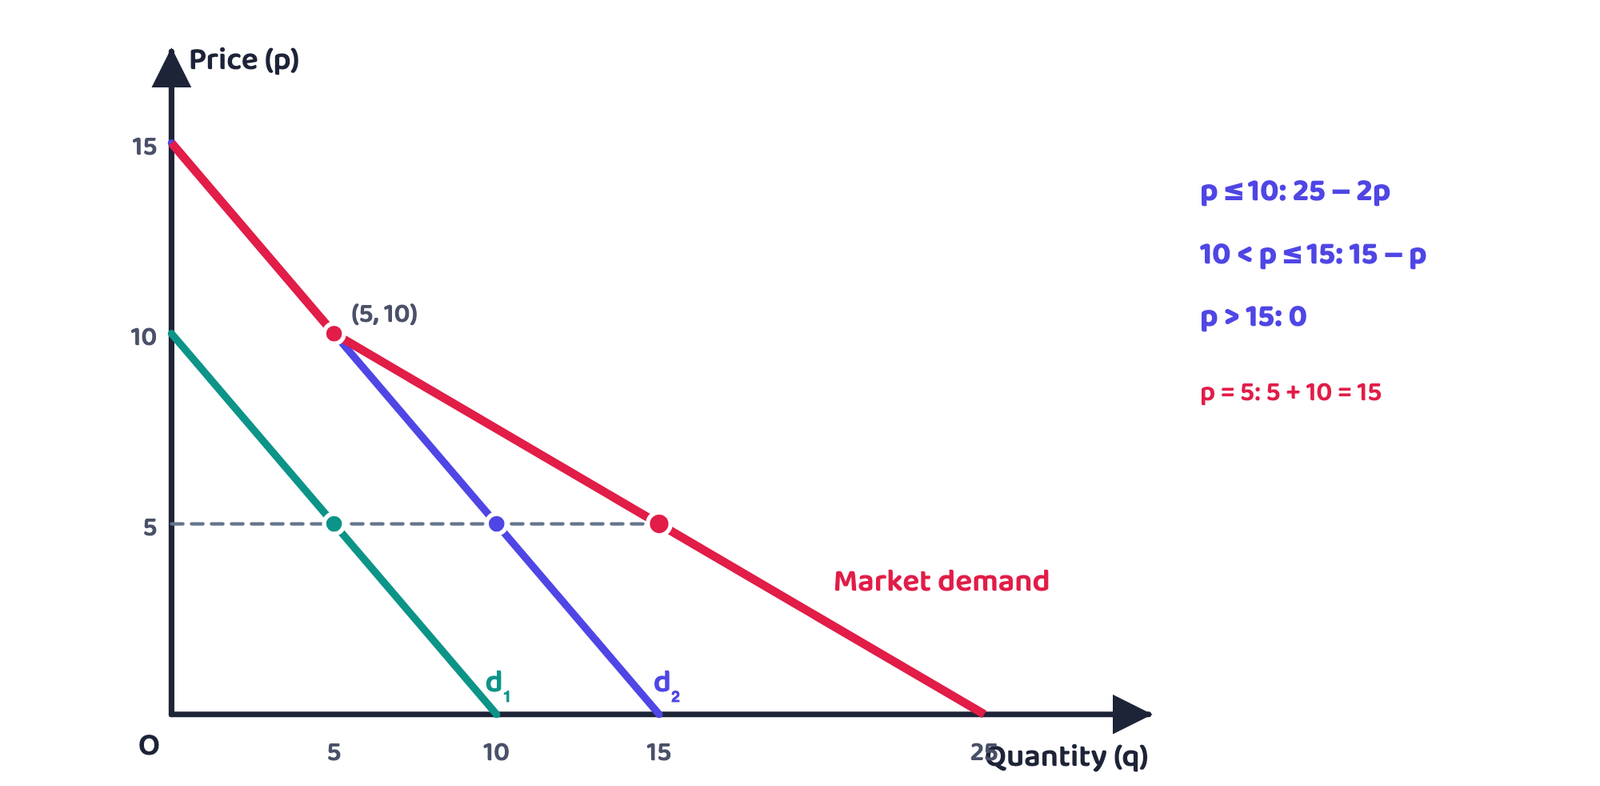
- Two consumers: if at price p′ the demands are and , market demand is ; the same addition is done at every price
- Graphically the individual demand curves are added horizontally (quantities are added at each price, not prices); this method is horizontal summation
- …(2.14), 0 at any price above 10; …(2.15), 0 at any price above 15
- p ≤ 10: both buy, market demand = (10 − p) + (15 − p) = 25 − 2p
- 10 < p ≤ 15: only consumer 2, market demand = 15 − p
- p > 15: market demand = 0
- Check: at p = 5, 5 + 10 = 15 = 25 − 2(5) ✓
- Adding the two equations at every price is wrong; where a consumer’s demand would turn negative it is taken as 0 (so above 10 it is 15 − p, not 25 − 2p)
- Adding prices (vertical summation) for a market curve is wrong; quantities are added
9 Price elasticity of demand
- Demand moves opposite to price, but the impact is not always the same: some goods’ demand changes a lot even for small price changes, some hardly at all
Price elasticity of demand is a measure of the responsiveness of the demand for a good to changes in its price: percentage change in demand for the good ÷ percentage change in its price.
Q. At ₹5 per banana a consumer buys 15 bananas; when the price rises to ₹7 she buys 12. Find the price elasticity of demand.
Given
= 5, = 7; = 15, = 12
To find
- % change in quantity (1)
- % change in price (1)
- 0.5 (absolute value) (1)
- Meaning: price rose 40% and demand fell only 20%; demand for bananas is not very responsive to price, that is, inelastic
| % change in quantity vs % change in price | Demand | Example (book) | |
|---|---|---|---|
| Smaller | < 1 | Inelastic | Essential goods |
| Larger | > 1 | Elastic | Luxury goods |
| Equal | = 1 | Unitary elastic | Rectangular hyperbola curve |
The demand for a good may be elastic, unitary elastic or inelastic at different prices (next section).
- Price ₹10 to ₹12, demand 100 to 80 units: % ΔQ = −20, % ΔP = +20; = 20/20 = 1 (unitary elastic)
- Price ₹10 to ₹8, demand 100 to 150 units: % ΔQ = +50, % ΔP = −20; = 50/20 = 2.5 (elastic)
- Elasticity given: = −1.5, price rises 20%, demand was 500 units; new demand? % ΔQ = −1.5 × 20 = −30; new demand = 500 × (1 − 0.30) = 350 units
Meaning: the higher the elasticity, the more demand changes for the same price change.
- Dividing by the new value when finding percentages is wrong; always divide by the original price and quantity (P, Q)
- Inverting the formula () is wrong; the percentage change in quantity goes on top
- Calling = −0.8 “elastic” is wrong; the absolute value 0.8 < 1, so it is inelastic
9.1 Elasticity along a linear demand curve
- On the linear demand curve , at every point ; putting this in (2.16b) gives , and putting in the value of q:

Q. The demand curve is q = 100 − 5p. Find the elasticity at p = 4, 10 and 16.
- Formula: , here a = 100, b = 5 (½)
- p = 4: q = 80, −0.25 (inelastic) (½)
- p = 10: q = 50, −1 (unitary elastic); a/2b = 100/10 = 10, the midpoint (½)
- p = 16: q = 20, −4 (elastic) (½)
- Meaning: on one straight line the slope stays the same but elasticity rises as we move up; slope and elasticity are not the same thing
Geometric measure (Not in CBSE 2026-27 syllabus)
- At any point on a straight-line demand curve, elasticity = the lower segment ÷ the upper segment at that point
- At a point D on q = a − bp (price , quantity ; B on the vertical axis, A on the horizontal axis): similar triangles ECD, and BOA give
- Elasticity is 0 where the curve meets the horizontal axis (A), ∞ where it meets the vertical axis (B), 1 at the midpoint; greater than 1 to the left of (above) the midpoint and less than 1 to the right of (below) it
- In the figure above, at D (4, 2): DA/DB = (10 − 4)/(4 − 0) = 1.5, which the formula also gives: 3 × 2 ÷ (10 − 6) = 1.5
9.2 Constant elasticity demand curves
- Vertical demand curve: whatever the price, demand stays at ; = 0, perfectly inelastic
- Horizontal demand curve: any quantity at the price , zero demand at any other price; = ∞, perfectly elastic
- Rectangular hyperbola (pq = constant): a percentage change in price always gives an equal percentage change in quantity; = 1 at every point, the unitary elastic demand curve

An equation xy = c (c a constant) gives a curve called a rectangular hyperbola, sloping downward in the x-y plane. For any two points on it, the rectangles under them have the same area (c). If a demand curve is pq = e, the consumer’s expenditure is always e, whichever point she consumes at.
9.3 Factors determining price elasticity of demand
Nature of the good
Necessities like food are essential for life, so their demand is inelastic; demand for luxuries is elastic
Close substitutes
Demand for food as a whole is inelastic, but for a particular variety of pulses it is elastic, because another variety is easily available. Without easily available close substitutes demand is inelastic
Time period (CBSE supplement)
Habits change over longer periods; the longer the period of response, the more elastic the demand
The higher the share of income spent on a good, the more elastic its demand; low priced goods have low elasticity
9.4 Elasticity and expenditure: the total expenditure method
- Expenditure on a good = price × quantity demanded
- Whether expenditure rises or falls when price changes depends on how responsive demand is to price
| Row | Price (P) | Quantity (Q) | % ΔP | % ΔQ | Expenditure (P × Q) | Price elasticity of demand |
|---|---|---|---|---|---|---|
| 1 | ↑ | ↓ | +10 | −8 | ↑ | Inelastic |
| 2 | ↑ | ↓ | +10 | −12 | ↓ | Elastic |
| 3 | ↑ | ↓ | +10 | −10 | About unchanged | Unit elastic |
| 4 | ↓ | ↑ | −10 | +15 | ↑ | Elastic |
| 5 | ↓ | ↑ | −10 | +7 | ↓ | Inelastic |
| 6 | ↓ | ↑ | −10 | +10 | About unchanged | Unit elastic |
Based on the book’s Table 2.5; each row’s expenditure and elasticity are recomputed from P × Q. In rows 3 and 6 expenditure is unchanged only approximately (1.1 × 0.9 = 0.99).
- Price ₹10 to ₹8, demand 100 to 150: expenditure ₹1,000 to ₹1,200; price fell, expenditure rose (opposite direction): elastic
- Price ₹10 to ₹12, demand 60 to 50: expenditure ₹600 and ₹600; unchanged: unitary elastic
- Price ₹4 to ₹5, demand 200 to 180: expenditure ₹800 to ₹900; price rose and expenditure also rose (same direction): inelastic. Check by the percentage method: % ΔQ = −10, % ΔP = +25, = 10/25 = 0.4 < 1 ✓
- At price p demand is q, at p + Δp demand is q + Δq; the change in expenditure
- For small changes is negligible, so
- : has the opposite sign to ; : the same sign; :
10 Key formulas and difference tables
| Basis | Normal good | Inferior good |
|---|---|---|
| Demand when income rises | Rises | Falls |
| Demand curve when income rises | Rightward | Leftward |
| Examples | Most goods, better quality cereals | Coarse cereals, low quality food |
| Basis | Perfectly elastic | Perfectly inelastic |
|---|---|---|
| ∞ | 0 | |
| Demand curve | Horizontal | Vertical |
| Meaning | A small price change makes demand zero | Whatever the price, demand stays the same |
- MU = TUn − TUn−1; TU is maximum when MU = 0; then MU is negative
- One good: MU = P; two goods: MUx/Px = MUy/Py and MU falling
- IC: equal satisfaction; slopes down, convex, a higher curve gives more satisfaction, curves never intersect
- MRS = |ΔY/ΔX|, diminishing (Table 2.2: 3, 2, 1); constant for perfect substitutes, IC a straight line
- Budget line ; intercepts M/p1, M/p2; slope −p1/p2
- Income changes: parallel shift; p1 changes: pivot about the vertical intercept
- Optimum: tangency, MRS = p1/p2, IC convex
- Price falls: substitution effect + income effect, demand rises; Giffen good the exception
- Own price changes: movement along; income, related prices, tastes change: shift
- Market demand: horizontal sum; d1 = 10 − p, d2 = 15 − p ⇒ 25 − 2p (p ≤ 10)
- eD = (ΔQ/ΔP)(P/Q); linear curve: −bp/(a − bp), 1 at the midpoint
- Elastic: expenditure opposite to price; inelastic: same direction; unitary: unchanged
- Can I work out MU from a TU table and draw the TU-MU diagram?
- Can I write the MUx/Px = MUy/Py condition and the “a rupee from Y to X” argument?
- Can I find MRS from Table 2.2 and draw a convex indifference curve?
- Can I prove that two indifference curves cannot intersect?
- Can I write the budget line, its intercepts and slope from any income and prices?
- Can I draw the tangency equilibrium (E, x1*, x2*)?
- Can I explain movement vs shift with diagrams?
- Can I find elasticity by the percentage method, the linear-curve formula and the total expenditure method?