
All the questions from the Exercise at the end of NCERT’s Practical Work in Geography Chapter 5, “Topographical Maps” (Chapter 25 on this site), in the exact order and wording as printed in the book (English edition), with a full solution to every question. The book itself does not give an answer key to any of these questions. Every solution here has been worked out from the chapter’s own method for the first time. Try solving each one yourself first, then check. (The book also carries Exercise A, B and C, built on a contour figure and on two extracts of Survey of India sheet 63K/12; they are answered at the end, read from the figures printed in the book.)
1 Answer the following questions in about 30 words
Q. What are topographical maps?
Answer: A map that shows both the natural features (relief, vegetation, water bodies) and the cultural features (cultivated land, settlements, transport networks) of the earth’s surface, at a relatively large scale, with relief shown through contours, is called a topographical map. These are general-purpose maps and serve as the base map for all other maps.
Q. Name the organisation which prepares the topographical maps of India.
Answer: The Survey of India prepares and publishes the topographical maps of India.
Q. Which are the commonly used scales for mapping our country used by the Survey of India?
Answer: The Survey of India uses five scales: 1 : 10,00,000 (coverage 4° × 4°), 1 : 2,50,000 (1° × 1°), 1 : 1,25,000 (30′ × 30′), 1 : 50,000 (15′ × 15′) and 1 : 25,000 (5′ × 7′30″); their numbering system is shown in the book’s Figure 5.1.
Q. What are contours?
Answer: An imaginary line joining points of equal elevation above mean sea level is called a contour; it is also called a level line. A map built up out of such lines to depict an area’s landform is itself known as a contour map.
Q. What does the spacing of contours indicate?
Answer: The spacing of contours indicates the steepness of the slope: closely spaced contours indicate a steep slope, while widely spaced contours indicate a gentle slope. This spacing is the horizontal equivalent (H.E.), which changes with the nature of the slope even though the contour interval (V.I.) stays constant.
Q. What are conventional signs?
Answer: Standardised signs and symbols used on topographical maps to show cultural and natural features such as roads, rivers, settlements, vegetation and places of worship are called conventional signs. They are internationally accepted, so anyone can read a map without knowing the local language.
2 Write short notes on
Q. Contours
Answer: An imaginary line joining points of equal elevation above mean sea level. Earlier, they were drawn using ground survey and levelling methods; aerial photography has now taken over that job. Their five basic features are: they show places of equal height; their shape and spacing show height and slope; closely/widely spaced contours show a steep/gentle slope; merging contours show a near-vertical feature (a cliff or waterfall); and contours of different elevation usually do not cross each other.
Q. ‘Marginal Information’ in Topographical sheets
Answer: The first of the five heads of map interpretation. It includes information such as the topographical sheet number, its location, grid references, its extent in degrees and minutes, the scale, and the districts it covers: this must be checked before reading the rest of the map.
Q. The Survey of India
Answer: India’s National Mapping Organisation, which prepares and publishes the country’s topographical maps. Until the Delhi Survey Conference of 1937 it prepared maps under both the India and Adjacent Countries Series; after that, mapping of the neighbouring countries was dropped and India’s own maps began to be prepared to the specifications of the new International Map Series, though the old numbering system and layout were retained.
3 The meaning and procedure of map interpretation
Q. Explain what is meant by ‘map interpretation’ and what procedure is followed for its interpretation.
Answer: Map interpretation means understanding the relationships between the many features shown on a map (relief, drainage, land use, settlement, transport): for example, understanding the distribution of vegetation and cultivation against the background of landform and drainage. This first needs knowledge of map language and direction: check the north line and scale to orient yourself, then read the legend. Interpretation is carried out under five heads: marginal information, relief and drainage, land use, transport and communication, and human settlement. The procedure has four steps: (i) use the sheet’s own index number to find its location within India and its general physiographic character, and note the scale and contour interval for the area’s general landform and extent; (ii) trace the major landforms, drainage and water features, land use, and settlement-transport pattern onto tracing paper; (iii) describe the distribution pattern of each feature separately, drawing attention to what matters most; (iv) superimpose pairs of these traced maps and note the relationship between them, for example combining a contour map with a land-use map to see the relationship between slope and land use. Aerial photographs and satellite imagery of the same area can also be used for comparison.
4 Information for interpreting cultural features
Q. If you are interpreting the cultural features from a topographical sheet, what information would you like to seek and how would you derive this information? Discuss with the help of suitable examples.
Answer: To interpret cultural features (settlements, buildings, roads, railways), I would look for their location, distribution pattern and density, since these help in understanding the area. This information comes from the conventional signs, symbols and colours printed on the sheet (for example, separate signs for a metalled and an unmetalled road, a broad-gauge and a narrow-gauge railway, or an inhabited and a deserted village). For settlements, I would compare the settlement map with the contour map to understand the type (compact, scattered, linear, circular) and its cause: for instance, settlements strung out along a river valley would show a linear pattern, caused by the nearness of a water source and a transport route. I would identify urban centres by their function: for example, roads radiating from a centre in every direction would suggest a nodal town, and a town on a coastline would suggest a port. For transport and communication, I would read the density and type from the conventional signs for national and state highways, district roads and railways, which would show a relationship with the area’s relief, population and resource development.
5 Drawing conventional signs
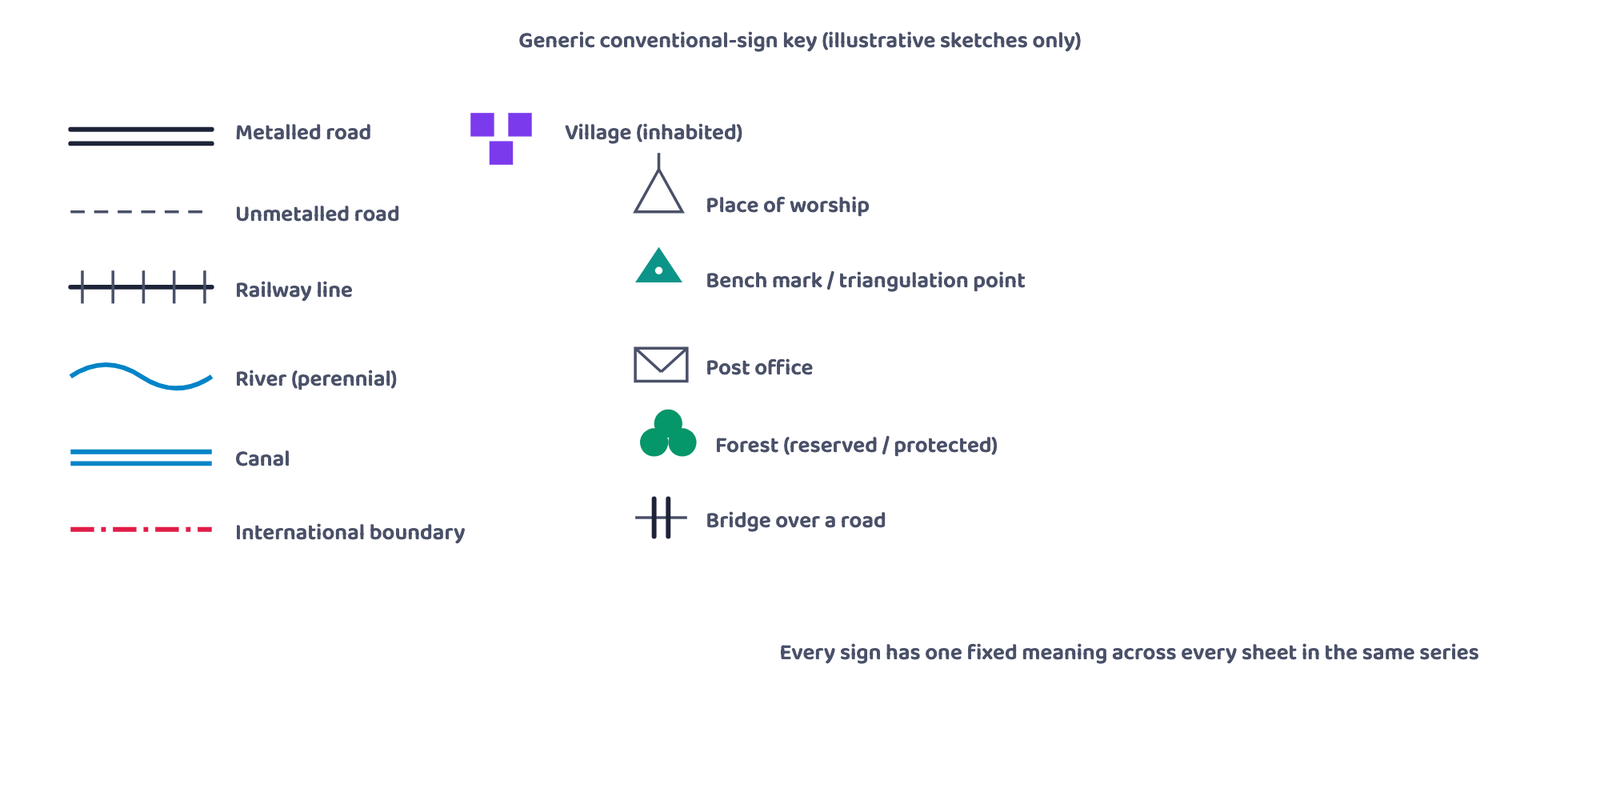
Q. Draw the conventional signs and symbols for the following features: (i) International Boundary (ii) Bench Mark (iii) Villages (iv) Metalled Road (v) Footpath with bridges (vi) Places of Worship (vii) Railway line
Answer: Draw each sign as the book’s Figure 5.2 (Conventional Signs and Symbols) shows it:
- (i) International Boundary: a black line of long dashes, each separated by a dot (a pattern like: long dash, dot, long dash, dot).
- (ii) Bench Mark: written as letters with the height beside them: BM 63.3 for a geodetic bench mark, DM 63.3 for a tertiary one, and a blue .63 for a canal bench mark. (A small triangle with a height, such as △200, is a triangulated height, not a bench mark.)
- (iii) Villages: an inhabited town or village is a red built-up block symbol; a deserted one is a red cross (×).
- (iv) Metalled Road: red lines, drawn according to importance in one of three ways: a double red line; a red line with a broken red line beside it; or a broken red line over a solid one with a distance stone shown by a small number such as 20.
- (v) Footpath with bridges: a red dotted line with a small bridge sign drawn across it where it crosses a stream.
- (vi) Places of Worship: small red symbols: a temple (a small building with a spire), a church (with a cross on top), a mosque and an idgah; the same row of the figure also shows a chhatri, a tomb and graves.
- (vii) Railway line: broad gauge is a black line of alternate black and white segments (a double line, or a single line with a station marked RS); other gauges are a black line with short cross-ticks.
6 Exercise A: the contour pattern
These answers are read from the contour figure printed with Exercise A (scale: 1 cm represents 2 km).
1. Name the geographical feature formed by contours.
Answer: A plateau: the contours form closed rings, with the innermost contour enclosing a wide, flat-topped area and the outer contours bunched close together along its margins.
2. Find out the contour interval in the map.
Answer: The figure prints no height values on its contours, so the contour interval cannot be read from it. On a map where values are given, the contour interval is the difference between the values of any two successive contours (for example, 100 m and 120 m give an interval of 20 m).
3. Find out the map distance between E and F and convert it into ground distance.
Answer: On the printed figure, E and F are about 1.8 cm apart. With 1 cm representing 2 km, the ground distance is 1.8 × 2 = about 3.6 km. (Measure with a ruler on your own book: multiply the centimetres you measure by 2 to get kilometres.)
4. Name the type of slope between A and B; C and D and E and F.
Answer: A to B: the contours are widely spaced, so the slope is gentle. C to D: the contours are crowded close together, so the slope is steep. E to F: the contours are widely spaced, so the slope is gentle.
5. Find out the direction of E, D and F from G.
Answer: With north at the top of the figure: E is to the west of G, D is to the north of G, and F is to the south-west of G.
7 Exercise B: extract of topographical sheet 63K/12
These answers are read from the sheet extract printed with Exercise B (Mirzapur and Varanasi districts, R.F. 1 : 50,000).
1. Convert 1:50,000 into a statement of scale.
Answer: 1 cm on the map represents 50,000 cm, that is, 1 cm represents 0.5 km (500 metres) on the ground.
2. Name the major settlements of the area.
Answer: Kachhwa (the largest, with a post and telegraph office, a market, an inspection bungalow and a hospital), Baraini, Majhwan, Bajahan and Bhatauli; smaller villages include Kanak Sarai, Semari, Gobra, Ramapur and Bhikharipur.
3. What is the direction of flow of the river Ganga?
Answer: The Ganga crosses the extract from the north-west towards the south-east, so it flows from north-west to south-east here.
4. At which one of the banks of river Ganga, Bhatauli is located?
Answer: Bhatauli lies on the south-western side of the river, which is the right bank of the Ganga (the right-hand side when facing downstream).
5. What is the pattern of rural settlements along the right bank of river Ganga?
Answer: The villages on the right bank (Bhatauli, Jaunsara, Bedauli Khurd, Bedauli Kalan, Kakarha, Chaulanpatti) are small and set apart from one another, so the pattern is scattered.
6. Name the villages/settlements where Post Office is located?
Answer: The sign PO appears at Baraini, Bhatauli and Majhwan, and at a village cut off at the western edge of the extract (only the end of its name, “…dhia”, is printed); Kachhwa has a PTO (post and telegraph office).
7. What does the yellow colour in the area refer to?
Answer: The yellow colour shows cultivated (agricultural) land.
8. What means of transportation is used to cross the river by the people of Bhatauli village?
Answer: A ferry: the sheet shows a ferry with six boats at Bhatauli Ghat.
8 Exercise C: second extract of sheet 63K/12
These answers are read from the sheet extract printed with Exercise C (Mirzapur and Varanasi districts, R.F. 1 : 50,000).
1. Give the height of the highest point on the map.
Answer: 208 metres, the spot height near Deophulwa in the south of the extract. (The triangulated height at Rajghat in the north is 174 m.)
2. River Jamtihwa Nadi is flowing through which quarter of the map?
Answer: The south-eastern quarter.
3. Which is the major settlement located in the east of the Kuardari Nala?
Answer: Katwa, strung along the main road, with a post office and a forest chauki.
4. What type of settlement does the area have?
Answer: Mostly small scattered (dispersed) settlements in a forested, hilly area (the Danti Reserved Forest covers much of it); Katwa is laid out in a line along the road.
5. Name the geographical feature represented by white patches in the middle of Sipu Nadi.
Answer: White patches in the middle of a river on a topographical sheet show sand: sand bars or sandy islands in the river bed. (The name Sipu Nadi itself is not legible on the printed extract.)
6. Name the two types of vegetation shown on part of the topographical sheet.
Answer: Fairly dense mixed jungle and open scrub (the sheet also shows fairly dense bamboo and open mixed jungle).
7. What is the direction of the flow of the Kuardari?
Answer: From north to south: it leaves the Lower Khajuri Dam area in the north and flows southwards across the sheet.
8. In which part of the sheet area is Lower Khajuri Dam located?
Answer: In the northern part of the sheet (north-central, near the top edge).
Questions 1 and 2 of the exercise are direct, definition-based questions of the 1-2 mark type. Questions 3 and 4 are long-answer style (4-6 marks): remember to write out the five heads and the four-step procedure of interpretation, in order, in your answer.