
Covers T.R. Jain & V.K. Ohri (2026-27) ch 2-4. Based on NCERT Introductory Macroeconomics, Chapter 2 (Reprint 2026-27) and the CBSE curriculum 2026-27.
- Tell a final good from an intermediate good, a consumption good from a capital good, and a stock from a flow
- Draw and explain the circular flow of income in a two-sector economy
- Calculate GDP and national income by the value added, expenditure and income methods, step by step
- Convert between GDP, NDP, GNP and NNP at market price and at factor cost
- Explain nominal and real GDP, the GDP deflator, and why GDP is not a full measure of welfare
1 Some Basic Concepts of Macroeconomics
Adam Smith, one of the pioneers of economics, named his most influential work An Enquiry into the Nature and Cause of the Wealth of Nations. A country is not rich just because it has natural resources: resource-rich Africa and Latin America have some of the poorest countries in the world, while many prosperous countries have scarcely any natural wealth. What matters is how resources generate a flow of production, and how income is generated from it. National income accounting therefore starts with the kinds of goods.
1.1 Final goods
A final good is an item meant for final use that will not pass through any more stages of production or transformation. Once sold, it passes out of the active economic flow.
- A farmer sells cotton to a spinning mill, the yarn goes to a textile mill, and the cloth becomes an article of clothing
- In this chain only the clothing is a final good, because it is sold to consumers for final use
- The buyer may still transform it (tea leaves become drinkable tea), and it remains a final good
- Cooking at home is not an economic activity, because home-cooked food is not sold in the market
A good becomes final not because of its nature but because of the economic nature of its use. Tea leaves bought by a household are a final good; the same tea leaves bought by a restaurant that sells tea become an input (intermediate good).
1.2 Consumption goods and consumer durables
Consumption goods (consumer goods) are final goods and services that are consumed when purchased by their ultimate consumers, such as food, clothing and services like recreation.
Consumer durables are consumption goods that are not used up in immediate or short-period consumption, have a relatively long life, and, like machines, undergo wear and tear and need repairs and replacement of parts, such as television sets, automobiles and home computers.
1.3 Capital goods
Capital goods are durable final goods used in the production process over many cycles that are not themselves transformed in production, such as tools, implements and machines.
- They are the crucial backbone of any production process, aiding and enabling production to take place
- They undergo gradual wear and tear, so they are repaired or gradually replaced over time
- They form part of capital, the factor of production in which an enterprise has invested
1.4 Intermediate goods
Intermediate goods are goods used by other producers as material inputs or raw material for producing other commodities, such as steel sheets used for making automobiles and copper used for making utensils. They are not final goods.
- Adding cloth, rice and machines needs a common measuring rod; that rod is money
- National income counts only the value of final goods
- The value of a final good already includes the value of the intermediate goods used to make it
- Counting intermediate goods separately causes double counting and exaggerates the value of output
| Good and buyer | Type | Why |
|---|---|---|
| Wheat bought by a household | Final (consumption) good | Final use, no further production |
| Wheat bought by a baker | Intermediate good | Used up making bread in the same year |
| Machine bought by a firm | Final (capital) good | Serves production for many years, not transformed |
| Television bought by a household | Final (consumer durable) good | For consumption, but long-lasting |
| Steel sheets bought by a car company | Intermediate good | Raw material for cars |
“A capital good is used in production, so it is intermediate” is wrong. Capital goods are not used up in production and last many years, so they are final goods. An intermediate good is one used up in production in the same year, or bought for resale.
1.5 Stocks and flows
A flow is a variable defined over a period of time, such as income, output or profits. A statement about a flow is meaningless without its time period.
A stock is a variable defined at a particular point of time, such as the buildings and machines in a factory (the capital stock).
- “Her salary is Rs 10,000” is incomplete until it says whether that is monthly or yearly
- A change in a stock is a flow, such as how many machines were added this year
- A machine can be part of the capital stock for many years, but part of the flow of new machines only in the year it was installed

| Basis | Stock | Flow |
|---|---|---|
| Measured | At a point of time | Over a period of time (per year, per month) |
| Time dimension | None | Has one |
| Examples | Capital, wealth, inventory, population, bank deposits | National income, investment, depreciation, output, change in inventories, value added |
| Tank example | Water in the tank | Water flowing in per minute |
1.6 Gross investment, depreciation and net investment
Gross investment is the part of final output that consists of capital goods (machines, tools, buildings, storehouses, and infrastructure such as roads, bridges and airports).
Depreciation is the annual allowance for the regular wear and tear of capital goods, deducted from gross investment to arrive at net investment. It is also called consumption of fixed capital.
- Net investment is also called new capital formation; it is the real addition to the capital stock
- A machine with a 20-year life loses one twentieth of its original value each year
- Depreciation is an accounting concept: it is accounted for every year even if no actual spending takes place that year
- With thousands of enterprises, some are always replacing equipment, so actual replacement spending roughly matches annual depreciation
- Unexpected or sudden destruction (accidents, natural calamities) is not depreciation
For economists, investment always means capital formation, a gross or net addition to the capital stock. Buying shares or property, or taking an insurance policy, is not investment in this sense.
Given
A machine costs ₹2,00,000 and lasts 20 years; gross investment in a year is ₹500 crore
To find
Annual depreciation of the machine; net investment if the economy’s depreciation is ₹80 crore
Formula: Annual depreciation = Cost ÷ Years of useful life
Substitution: ₹2,00,000 ÷ 20 = ₹10,000 per year
Formula: Net investment = Gross investment − Depreciation
Substitution: 500 − 80 = ₹420 crore
Meaning: of ₹500 crore of new capital goods, ₹80 crore only replaced worn-out capital; the capital stock actually grew by ₹420 crore.
1.7 The trade-off between consumption and capital goods
- In a year, total final output is either consumption or investment
- For a given total output, more capital goods means fewer consumer goods
- But capital goods raise a labourer’s productivity: a traditional weaver takes months to weave a sari, while modern machinery produces thousands of pieces of clothing a day; the Pyramids and the Taj Mahal took decades, a skyscraper now takes a few years
- So more capital goods today mean more total output and more consumer goods in future; there is no contradiction, the difference is time
2 The Circular Flow of Income (Two-Sector Model)
Production generates incomes for the factors, and the same incomes buy the firms’ goods. Production and consumption are therefore linked in a circle.
2.1 Assumptions of the simple economy
- Only two sectors: households and firms
- Households do not save; they spend their entire income on goods and services of domestic firms
- No government, so no taxes
- No external trade, so no imports or exports
- So there is no leakage: what firms pay out as factor payments comes back to them as sales revenue
2.2 The four factors of production and their remuneration
| Factor | Contribution | Remuneration |
|---|---|---|
| Labour | Human labour | Wage |
| Capital | Contribution of capital | Interest |
| Entrepreneurship | Organising production and bearing risk | Profit |
| Land | Fixed natural resources | Rent |

- The top two arrows are the goods and services market: households’ spending (towards firms) on top, the goods and services (towards households) below it
- The bottom two arrows are the factors of production market: households’ factor services (towards firms) at the very bottom, firms’ factor payments (towards households) above it
- The same amount of money moves round the circle, so measuring the annual flow at any point gives the same answer
| Point | What is measured | Method |
|---|---|---|
| A | Aggregate spending firms receive for final goods and services | Expenditure method |
| B | Aggregate value of final goods and services produced by all firms | Product (value added) method |
| C | Sum of all factor payments | Income method |
Real flow
- Flow of goods, services and factor services
- Factor services: households to firms
- Goods and services: firms to households
Money flow
- Flow of money (rupees)
- Factor payments: firms to households
- Consumption expenditure: households to firms
2.3 More spending leads to more income
- Suppose households decide to spend more (say, by borrowing)
- Firms produce more to meet this extra demand
- To produce more, firms pay the factors extra remuneration equal to the value of the extra output
- So households’ income rises by exactly the amount needed for the extra spending
- This holds for the whole economy, not one household: a single worker spending more does not raise her own income
A macroeconomic model is a simplified story describing the functioning of an imaginary economy. It does not describe an actual economy in every detail but highlights its essential features, without simplifying so far that it misrepresents the economy’s essential nature.
- Adding savings to the model does not change the main conclusion
- However complicated the economy, the annual production estimated by each of the three methods is the same
3 Three Methods of Calculating National Income
3.1 Product or value added method
The book’s example: the economy has only farmers (wheat) and bakers (bread). Farmers grow ₹100 of wheat with no input other than labour and sell ₹50 of it to the bakers. The bakers use it all to produce ₹200 of bread.
| Farmer | Baker | |
|---|---|---|
| Total production | 100 | 200 |
| Intermediate goods used | 0 | 50 |
| Value added | 100 | 200 − 50 = 150 |
- Adding the two outputs (100 + 200 = ₹300) is wrong: the ₹50 of wheat would be counted twice, once as the farmer’s output and again inside the value of the bread
- The correct value of aggregate production = 100 + 150 = ₹250
Value added of a firm = value of production of the firm − value of intermediate goods used by the firm. It is the firm’s net contribution to production.
Double counting is counting the value of a good more than once while estimating output, which happens when intermediate goods are added to final goods, and which overstates national income.
- A firm’s value added is distributed among its four factors: wages + interest + profits + rent = value added
- Value added is a flow variable
- If the farmer uses fertilisers or pesticides, their value must also be deducted from the value of wheat
Gross value added is value added that includes depreciation; deducting depreciation from gross value added gives net value added.
Given
A firm produces ₹100 a year, uses ₹20 of intermediate goods, and its capital consumption (depreciation) is ₹10
To find
Gross and net value added
Formula: Gross value added = Value of output − Intermediate goods
Substitution: 100 − 20 = ₹80 per year
Formula: Net value added = Gross value added − Depreciation
Substitution: 80 − 10 = ₹70 per year
3.2 Inventories and change in inventories
Inventory is the stock of unsold finished goods, semi-finished goods or raw materials that a firm carries from one year to the next. Inventory is a stock variable.
- A rise in inventories is accumulation; a fall is decumulation
- The change in inventories takes place over a period, so it is a flow variable (inventory itself is a stock)
- The sign “≡” stands for an identity, which holds whatever the values of the variables (2 + 2 ≡ 4); “=” is an equality that holds only for particular values (2 × x = 4 only when x = 2)
Given
Unsold stock at the start of the year ₹100; production during the year ₹1,000; sales ₹800
To find
Change in inventories and closing inventory
Formula: Change in inventories = Production − Sales
Substitution: 1,000 − 800 = ₹200
Closing inventory: 100 + 200 = ₹300
Investment is an addition to the stock of capital of a firm. Inventories are treated as capital, so a change in inventories is also investment.
Inventory investment
Rise in the value of a firm’s inventories over a year
Fixed business investment
Additions to machinery, factory buildings and equipment of firms
Residential investment
Additions to housing facilities
Planned and unplanned changes (the shirt example)
A firm starts the year with 100 shirts and expects to sell 1,000.
| Situation | Production | Sales | Closing inventory | Result |
|---|---|---|---|---|
| Sales unexpectedly low | 1,000 | 600 | 400 + 100 = 500 | Unplanned accumulation of 400 |
| Sales unexpectedly high | 1,000 | 1,050 | 100 − 50 = 50 | Unplanned decumulation of 50 |
| Wants inventory of 200 | 1,000 + 100 = 1,100 | 1,000 | 200 | Planned accumulation of 100 |
| Wants inventory of 25 | 1,000 − 75 = 925 | 1,000 | 25 | Planned decumulation of 75 |
Planned change
- Decided in advance by the firm
- Sales turn out as expected
- Example: raising stock from 100 to 200
Unplanned change
- Caused by an unexpected fall or rise in sales
- Not intended by the firm
- Example: 400 shirts left unsold when only 600 sell
3.3 Identities of the value added method
…(2.1)
- Net value added of firm i ≡ − depreciation of the firm ()
- The sum of gross value added of all N firms in the economy is Gross Domestic Product
…(2.2)
Given (₹ crore)
Sales 2,300; change in stock 200; intermediate consumption 1,000; consumption of fixed capital 120; net indirect taxes 180; net factor income from abroad (−) 30
To find
GDPMP and national income (value added method)
Formula: Value of output = Sales + Change in stock = 2,300 + 200 = ₹2,500 crore
Formula: GDPMP = Value of output − Intermediate consumption
Substitution: 2,500 − 1,000 = ₹1,500 crore
Formula: National income = GDPMP − Depreciation − Net indirect taxes + NFIA
Substitution: 1,500 − 120 − 180 + (−30) = ₹1,170 crore
Meaning: ₹1,500 crore of final output was produced within the domestic territory; after wear and tear, taxes and the net share of foreigners, residents’ factor income was ₹1,170 crore.
- Treating sales as output: forgetting to add the change in stock (or subtract it when it is negative)
- Deducting purchases of capital goods instead of intermediate consumption
- Adding a negative NFIA: (−) 30 means subtract 30
3.4 Expenditure method
This method measures output from the demand side: it adds the final expenditures each firm receives. In the farmer-baker example, the baker receives ₹200 of final expenditure and the farmer ₹50 (from households); the ₹50 of wheat bought by the baker is intermediate, so the total = 200 + 50 = ₹250.
Final expenditure is that part of expenditure which is not undertaken for intermediate purposes, i.e. expenditure on final goods and services.
| Symbol | Type of final expenditure | Note |
|---|---|---|
| C | Final consumption expenditure | Mostly households; also firms buying consumables for guests or employees |
| I | Final investment expenditure | By other firms on capital goods; investment goods remain with the firm, so they are counted |
| G | Government final expenditure | Both consumption and investment |
| X | Exports | Foreigners’ spending on the economy’s goods |
| M | Imports (subtracted) | The part of C, I and G spent on foreign goods: M ≡ Cm + Im + Gm |
…(2.4)
- Domestic firms receive C − Cm, I − Im and G − Gm; adding exports gives the identity above
- Of the five variables on the right-hand side, investment expenditure (I) is the most unstable
| National accounts name | Meaning |
|---|---|
| Private final consumption expenditure (PFCE) | C of households and private non-profit institutions |
| Government final consumption expenditure (GFCE) | Government’s consumption spending |
| Gross domestic capital formation (GDCF) | Gross fixed capital formation + change in stock (investment I; India’s accounts also add valuables) |
| Net exports (X − M) | Exports − imports; may be negative |
Given (₹ crore)
Private final consumption expenditure 1,000; government final consumption expenditure 300; gross fixed capital formation 350; change in stock 50; net exports (−) 40; depreciation 60; net indirect taxes 90; NFIA 20
To find
GDPMP and national income (expenditure method)
Formula: GDCF = Gross fixed capital formation + Change in stock = 350 + 50 = ₹400 crore
Formula: GDPMP = PFCE + GFCE + GDCF + (X − M)
Substitution: 1,000 + 300 + 400 + (−40) = ₹1,660 crore
Formula: NNPFC = GDPMP − Depreciation − Net indirect taxes + NFIA
Substitution: 1,660 − 60 − 90 + 20 = ₹1,530 crore
Meaning: total final spending on domestic output was ₹1,660 crore; the residents’ total factor income (national income) is ₹1,530 crore.
- Adding purchases of intermediate goods (raw materials) to expenditure
- Adding imports instead of subtracting them; subtracting when net exports are negative
- Adding GDCF and the change in stock separately, though GDCF already contains it
3.5 Income method
Firms’ total revenue is finally distributed among the factors as wages, salaries, profits, interest and rent. So adding factor incomes gives the same GDP.
…(2.5)
…(2.6)
In identity (2.6), I stands for both planned and unplanned investment of the firms.
In national accounts the income method is written with these components (CBSE Supplementary Reading Material):
| Component | What it includes |
|---|---|
| Compensation of employees | Wages and salaries in cash and in kind, employers’ social security contributions |
| Rent (and royalty) | Payment for the use of land; royalty: payment for leasing rights to sub-soil assets such as minerals |
| Interest | Payment by a production unit on borrowed capital |
| Profit | Dividends + corporate tax + undistributed profits |
| Mixed income | Income of the self-employed (doctors, chartered accountants, consultants) where the labour and capital shares cannot be separated |
Rent + interest + profit together are called operating surplus. The sum of these components gives NDPFC.
Given (₹ crore)
Compensation of employees 800; rent 150; interest 120; dividends 180; corporate tax 70; undistributed profits 50; mixed income 200; NFIA (−) 20
To find
National income (income method)
Formula: Profit = Dividends + Corporate tax + Undistributed profits = 180 + 70 + 50 = ₹300 crore
Formula: NDPFC = Compensation of employees + Rent + Interest + Profit + Mixed income
Substitution: 800 + 150 + 120 + 300 + 200 = ₹1,570 crore
Formula: NNPFC = NDPFC + NFIA = 1,570 + (−20) = ₹1,550 crore
Meaning: residents received ₹1,550 crore of factor income for their contribution to production.
- Adding both “profit” and “dividends” when both are given: dividends are part of profit. In the example above this mistake gives ₹1,750 crore (NDPFC)
- Adding transfer payments such as pensions, scholarships and gifts to factor income
- The income method gives NDPFC directly, not GDPMP; to get GDPMP, add depreciation and net indirect taxes
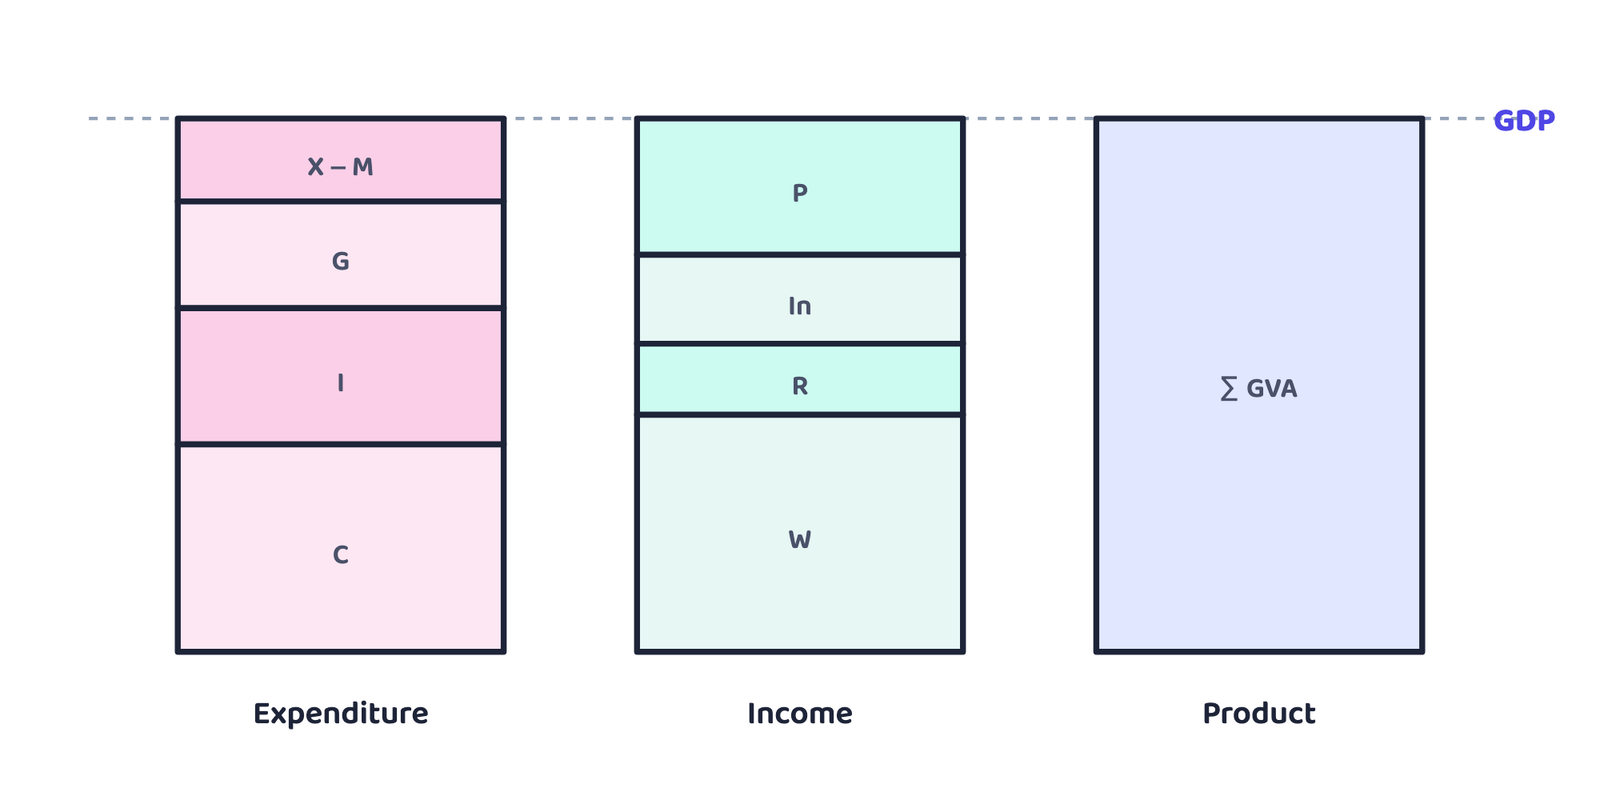
3.6 The three methods give the same answer (book example)
Firm A uses no raw material and produces cotton worth ₹50, which it sells to firm B. B makes cloth and sells it to consumers for ₹200. A pays ₹20 as wages and keeps ₹30 as profit; B pays ₹60 as wages and keeps ₹90 as profit.
| Firm A | Firm B | |
|---|---|---|
| Sales | 50 | 200 |
| Intermediate consumption | 0 | 50 |
| Value added | 50 | 150 |
| Wages | 20 | 60 |
| Profits | 30 | 90 |
Phase of production (value added)
VAA = 50 − 0 = 50; VAB = 200 − 50 = 150; GDP = 200
Phase of disposition (expenditure)
Only final expenditure is by consumers on cloth: GDP = 200
Phase of distribution (income)
Wages 20 + 60 = 80; profits 30 + 90 = 120; GDP = 200
Rent and interest are left out of this example; after paying wages, the rest of value added is distributed among rent, interest and profits (together called operating surplus). This does not change the result.
Given (₹ crore)
Value of output 3,000; intermediate consumption 1,400; private final consumption expenditure 900; government final consumption expenditure 250; gross domestic capital formation 500; net exports (−) 50
To show
GDPMP is the same by the value added and expenditure methods
Value added method: GDPMP = Value of output − Intermediate consumption = 3,000 − 1,400 = ₹1,600 crore
Expenditure method: GDPMP = PFCE + GFCE + GDCF + (X − M) = 900 + 250 + 500 + (−50) = ₹1,600 crore
Conclusion: both give ₹1,600 crore, because the value of final output is exactly the final expenditure made on it.
3.7 What is included in national income, and what is not (precautions)
CBSE papers ask “giving reason, state whether this is included in national income”. One rule decides every case: only this year’s final production, and the factor incomes it creates, are counted.
| Item | Included? | Reason |
|---|---|---|
| Sale of a second-hand car | No | Already counted in the year it was produced; not fresh production |
| Broker’s commission on that sale | Yes | The broker’s service is fresh production this year |
| Purchase or sale of shares, bonds | No | Transfer of a financial asset; no good or service produced |
| Old-age pension, scholarship, gift, donation | No | Transfer payments: no service rendered in return |
| Farmer’s own consumption of his output | Yes | Production took place, though not sold |
| Imputed rent of an owner-occupied house | Yes | The house renders a service; the owner in effect pays rent to himself |
| Domestic services of a homemaker | No | Not evaluated in money, not sold in the market |
| Purchase of raw materials by a firm | No | Intermediate expenditure; counting it is double counting |
| Purchase of a new machine by a firm | Yes | Final (investment) expenditure |
| Capital gain on selling an old asset or shares | No | Not a factor income from production |
4 Domestic vs National, Market Price vs Factor Cost
4.1 Domestic territory and normal residents
- Domestic (economic) territory: the geographical territory administered by a government within which persons, goods and capital circulate freely; it includes the country’s own embassies abroad, but not foreign embassies located within it (CBSE Supplementary Reading Material)
- Normal resident: a person or institution whose centre of economic interest lies in that country; not necessarily a citizen
- Domestic product (GDP, NDP): production within the domestic territory, by residents or non-residents
- National product (GNP, NNP): production by the country’s normal residents, inside or outside the territory
4.2 Net factor income from abroad and Gross National Product
- The wage of an Indian citizen working in Saudi Arabia is included in Saudi Arabia’s GDP, not India’s
- The profits of the Korean-owned Hyundai car factory in India are in India’s GDP but are not income of Indians
- The variable that accounts for both is Gross National Product
Net factor income from abroad (NFIA) = factor income earned by the domestic factors of production employed in the rest of the world − factor income earned by the factors of production of the rest of the world employed in the domestic economy.
Gross National Product (GNP) ≡ GDP + net factor income from abroad. It is the value of all final goods and services produced by a country’s normal residents in a year, whether located within the national boundary or abroad.
4.3 Gross vs net
- Depreciation does not become anybody’s income, so “gross” minus depreciation gives “net”
- Net National Product (at market prices) ≡ GNP − depreciation
- Net Domestic Product NDPMP = GDPMP − depreciation: it shows how much the country must spend just to maintain its current GDP; if lost capital is not replaced, GDP will fall
4.4 Market price vs factor cost
- Market prices include indirect taxes, which go to the government, not to the factors; so they are deducted
- The government gives subsidies on some goods, which producers receive; so they are added (in India petrol is heavily taxed while cooking gas is subsidised)
- Net indirect taxes ≡ indirect taxes − subsidies
- Value at factor cost = value at market price − net indirect taxes
National Income (NI) ≡ Net National Product at factor cost ≡ NNP at market prices − (indirect taxes − subsidies). It is the sum of income earned by all the factors of a country in the form of wages, profits, rent and interest in a year, whether production took place in the domestic territory or abroad.
4.5 Basic prices and GVA (Not in CBSE 2026-27 syllabus)
- In India the most highlighted measure used to be GDP at factor cost
- In its January 2015 revision the Central Statistics Office (CSO) replaced GDP at factor cost with GVA at basic prices, and GDP at market prices (now called only “GDP”) became the most highlighted measure
- Production taxes and subsidies are independent of the volume of production (land revenues, stamp and registration fee)
- Product taxes and subsidies are paid or received per unit of product (excise tax, service tax, export and import duties)
- Factor cost includes no tax; basic prices lie in between: they include net production taxes but not net product taxes
4.6 All the aggregates together (Table 2.4)
| Aggregate | Meaning | Formula |
|---|---|---|
| Gross Domestic Product at market prices (GDPMP) | Market value of all final goods and services produced within the domestic territory in a year; production by residents and non-residents | C + I + G + X − M |
| GDP at factor cost (GDPFC) | Value of output produced by firms within the domestic territory, as received by producers | GDPMP − net indirect taxes |
| Net Domestic Product at market prices (NDPMP) | Domestic product after depreciation | GDPMP − depreciation |
| NDP at factor cost (NDPFC) | Income earned by factors as wages, profits, rent, interest within the domestic territory (domestic income) | NDPMP − net indirect taxes |
| Gross National Product at market prices (GNPMP) | Final output of normal residents, at home or abroad | GDPMP + NFIA |
| GNP at factor cost (GNPFC) | Value of output received by the factors belonging to a country | GNPMP − net indirect taxes |
| Net National Product at market prices (NNPMP) | A measure of how much a country can consume in a period | GNPMP − depreciation = NDPMP + NFIA |
| NNP at factor cost (NNPFC) = National Income | Factor income of all the factors of a country in a year | NNPMP − net indirect taxes = NDPFC + NFIA |
Table 2.4 follows the United Nations System of National Accounts 2008 (SNA 2008), which India adopted a few years back. The book subtracts both net product taxes and net production taxes from the market-price aggregates; together they make up the net indirect taxes that CBSE questions use. Row 9 of Table 2.4: GVA at market prices = GDP at market prices; GVA at basic prices = GVA at market prices − net product taxes; GVA at factor cost = GVA at basic prices − net production taxes.

Given (₹ crore)
GDPMP 5,000; NFIA (−) 100; net indirect taxes 400; national income 4,200
To find
Depreciation
Formula: NI = GDPMP + NFIA − Depreciation − Net indirect taxes
Substitution: 4,200 = 5,000 + (−100) − Depreciation − 400
4,200 = 4,500 − Depreciation, so Depreciation = ₹300 crore
- Going from domestic to national, NFIA is added; going back from national to domestic, it is subtracted
- Watch the sign of subsidies (third rule above): moving to factor cost, subsidies are added
- “National income” always means NNPFC, not GDP
5 Personal Income and Disposable Income (Not in CBSE 2026-27 syllabus)
State boards teach from the same book, so this part is given briefly.
- Undistributed profits and corporate tax do not reach households, so they are deducted
- Transfer payments (pensions, scholarships, prizes) reach households, so they are added
- After personal taxes (income tax) and non-tax payments (fines), households have complete say over what is left; they consume part of it and save the rest
- National disposable income shows the maximum goods and services the domestic economy has at its disposal (current transfers such as gifts and aid included)
Given (₹ crore)
National income 4,000; undistributed profits 300; corporate tax 200; net interest paid by households 100; transfer payments 250; personal tax 400; non-tax payments 50
To find
Personal income and personal disposable income
PI = 4,000 − 300 − 100 − 200 + 250 = ₹3,650 crore
PDI = 3,650 − 400 − 50 = ₹3,200 crore
6 Nominal and Real GDP
If GDP in one year is double that of the previous year, production may not have doubled; prices alone may have doubled. So comparisons across years or countries need real GDP.
Nominal GDP is the value of GDP at the current prevailing prices.
Real GDP is GDP calculated by valuing goods and services at a constant set of prices (the prices of a base year). A change in real GDP shows only a change in the volume of production.
The book’s example: a country produces only bread. In 2000 it produced 100 units at ₹10 each; in 2001, 110 units at ₹15 each. 2000 is the base year.

6.1 GDP deflator
The GDP deflator is the ratio of nominal GDP to real GDP. It shows how prices have moved from the base year to the current year.
Given
Nominal GDP in 2001 ₹1,650; real GDP at 2000 prices ₹1,100
To find
GDP deflator
Formula: GDP deflator = Nominal GDP ÷ Real GDP
Substitution: 1,650 ÷ 1,100 = 1.5 (i.e. 150 per cent)
Meaning: the price of bread in 2001 was 1.5 times its 2000 price, which is true since it rose from ₹10 to ₹15.
(a) Nominal GDP ₹2,400 crore, real GDP ₹2,000 crore. Deflator = 2,400 ÷ 2,000 × 100 = 120; the price level has risen 20% since the base year.
(b) Nominal GDP ₹3,300 crore, deflator 110. Real GDP = Nominal GDP ÷ Deflator × 100 = 3,300 ÷ 110 × 100 = ₹3,000 crore.
Nominal GDP
- At current-year prices
- Changes with both price and quantity
- Looks inflated when prices rise
Real GDP
- At constant base-year prices
- Changes only with quantity
- The better measure for comparing growth and welfare
In source-based questions, “GDP adjusted for inflation” or “GDP at constant prices” means real GDP. Its benefit: it shows that the quantity of goods and services has really increased, not just prices.
6.2 Consumer Price Index and Wholesale Price Index (Not in CBSE 2026-27 syllabus)
- Consumer Price Index (CPI): the index of prices of a given basket of commodities bought by the representative consumer; the current-year cost is expressed as a percentage of the base-year cost
- Book example: a consumer buys 90 kg of rice and 5 pieces of cloth a year. In 2000 rice is ₹10/kg and cloth ₹100: cost 900 + 500 = ₹1,400. In 2005 rice is ₹15 and cloth ₹120: cost 1,350 + 600 = ₹1,950
- CPI = 1,950 ÷ 1,400 × 100 = 139.29 (approximately)
- The retail price is what consumers pay; the wholesale price is the price at which goods are traded in bulk; traders’ margins separate the two
- The index of wholesale prices is the Wholesale Price Index (WPI); in countries like the USA it is called the Producer Price Index (PPI)
| CPI (and WPI) | GDP deflator |
|---|---|
| Only goods bought by consumers, which do not represent all goods produced | All goods and services produced in the country |
| Includes prices of imported goods | Does not include prices of imported goods |
| Weights are constant | Weights differ with the production level of each good |
7 GDP and Welfare
More income lets a person buy more, so it is tempting to treat a higher GDP (real GDP, to remove price changes) as greater welfare. The book gives at least three reasons why this may not be correct.
7.1 The three reasons
Distribution of GDP: how uniform is it
A rise in GDP may be concentrated in the hands of a few individuals or firms while the rest see their income fall.
Non-monetary exchanges
Domestic services women perform at home and barter in the informal sector are not evaluated in money; GDP is underestimated.
Externalities
Benefits or harms a firm or individual causes to others for which they are not paid (or penalised); there is no market for them.
7.2 The book’s distribution example
- Year 2000: 100 people each earn ₹10, so GDP = ₹1,000 (income method)
- Year 2001: 90 people earn ₹9 and 10 people earn ₹20; GDP = 90 × 9 + 10 × 20 = 810 + 200 = ₹1,010
- GDP rose by ₹10, but 90 per cent of people saw their real income fall by 10 per cent (₹10 to ₹9), while only 10 per cent gained 100 per cent (₹10 to ₹20)
- If welfare is judged by the percentage of people who are better off, GDP is not a good index

7.3 Externalities: the oil refinery example
Externalities are the benefits (or harms) a firm or an individual causes to another for which they are not paid (or penalised). Externalities do not have any market in which they can be bought and sold.
Negative externality
- Harm to others, such as pollution
- GDP overestimates welfare
Positive externality
- Benefit to others without payment
- GDP underestimates welfare
8 Key Formulas
| To find | Formula |
|---|---|
| Net investment | Gross investment − Depreciation |
| Value added (gross) | Value of output − Intermediate consumption; value of output = Sales + Change in stock |
| Net value added | Gross value added − Depreciation |
| Change in inventories | Production − Sales = Closing stock − Opening stock |
| GDPMP (expenditure method) | C + I + G + (X − M) = PFCE + GFCE + GDCF + Net exports |
| NDPFC (income method) | Compensation of employees + Rent + Interest + Profit + Mixed income |
| GNP | GDP + NFIA |
| NNPMP | GNPMP − Depreciation |
| National income (NNPFC) | NNPMP − (Indirect taxes − Subsidies) = NDPFC + NFIA |
| GDP deflator | Nominal GDP ÷ Real GDP (× 100) |
| Real GDP | Nominal GDP ÷ Deflator × 100 |
| PI / PDI (not in CBSE) | PI = NI − Undistributed profits − Net interest paid by households − Corporate tax + Transfers; PDI = PI − Personal tax − Non-tax payments |
9 Differences the Exam Asks
| Basis | Final goods | Intermediate goods |
|---|---|---|
| Use | Final consumption or investment | Inputs in other production in the same year, or for resale |
| In national income | Counted | Not counted separately (double counting) |
| Example | Bread bought by a household, machine bought by a firm | Wheat bought by a baker, steel of a car company |
| Basis | Consumption goods | Capital goods |
|---|---|---|
| Purpose | Direct satisfaction of consumers’ wants | Production of other goods |
| Buyer | Mainly households | Mainly producers (firms) |
| Example | Food, clothing, television | Machines, tools, factory buildings |
| Basis | Gross investment | Net investment |
|---|---|---|
| Meaning | All capital goods produced in the year | Real new addition to the capital stock |
| Depreciation | Included | Deducted |
| Relation | Net investment = Gross investment − Depreciation | |
| Basis | Domestic income (NDPFC) | National income (NNPFC) |
|---|---|---|
| Coverage | Earned within the domestic territory, by residents or non-residents | Earned by normal residents, at home or abroad |
| Relation | National income = Domestic income + NFIA | |
| Basis | At market price | At factor cost |
|---|---|---|
| Whose price | What the consumer pays | What the producer receives |
| Indirect taxes, subsidies | Indirect taxes included, subsidies netted out | Net indirect taxes removed |
| Relation | The third conversion rule in section 4.4 | |
- A good is final because of the economic nature of its use; counting intermediate goods separately is double counting
- Capital goods and consumer durables are final goods
- Stock at a point of time, flow over a period; capital is a stock, investment a flow
- Net investment = gross investment − depreciation; depreciation is the annual allowance for wear and tear
- Circular flow: expenditure at A, product at B, income at C; all three equal
- Value added = value of output − intermediate consumption; output = sales + change in stock
- GDP ≡ ∑GVA ≡ C + I + G + X − M ≡ W + P + In + R
- GNP = GDP + NFIA; NNP = GNP − depreciation; NI = NNPMP − net indirect taxes
- Second-hand goods, shares, transfer payments are excluded; own-account production and imputed rent are included
- Real GDP is at base-year prices; GDP deflator = nominal ÷ real
- GDP is not a full index of welfare: distribution, non-monetary exchanges, externalities
- Can I draw the circular flow with all four arrows and points A, B, C?
- Can I calculate national income by all three methods from any data, showing every step?
- Can I give a one-line reason for every “included / not included” item?
- Can I find real GDP from nominal GDP and the deflator?