- The nine official land-use categories, and how “reporting area” differs from “geographical area”
- Which land-use categories increased and which declined between 1950-51 and 2019-20, and why
- What Common Property Resources are and why they matter most to landless and marginal households
- How to calculate cropping intensity, and the difference between the three cropping seasons
- The growing conditions, leading states and output share of India’s major food, oilseed, fibre and plantation crops
- How Indian agriculture developed after Independence, and the eight problems it still faces
1Land-Use Categories
All the land around you is put to some use: a school, a road, a park, a field, a pasture. The land revenue department keeps records of these uses, and the categories it records add up to the reporting area. This is not quite the same as the geographical area, which the Survey of India measures directly and which stays fixed. Reporting area can shift a little because it depends on land revenue estimates, while geographical area does not change.
Reporting area
- Sum of the nine land-use categories in land revenue records
- Can change slightly with revenue estimates
Geographical area
- Measured directly by the Survey of India
- Fixed, does not change
The land revenue records classify all land into nine categories:
| # | Category | What it means |
|---|---|---|
| 1 | Forests | Area the Government has demarcated for forest growth, not the same as area under actual forest cover |
| 2 | Barren and wastelands | Barren hilly terrain, deserts, ravines: cannot be cultivated with today’s technology |
| 3 | Land under non-agricultural uses | Settlements (rural + urban), infrastructure (roads, canals), industries, shops |
| 4 | Permanent pastures and grazing lands | Mostly owned by the village Panchayat or Government; only a small share is private |
| 5 | Miscellaneous tree crops and groves | Orchards and fruit trees; mostly private land; excluded from net sown area |
| 6 | Culturable wasteland | Left fallow for more than 5 years; can be reclaimed for cultivation |
| 7 | Current fallow | Left uncultivated for one agricultural year or less, to let the land recover fertility |
| 8 | Fallow other than current fallow | Left uncultivated for more than a year but less than five years |
| 9 | Net area sown | The physical extent of land on which crops are sown and harvested |
Category 6 (culturable wasteland, fallow >5 years) and category 8 (fallow 1-5 years) get mixed up. Remember: if fallow land crosses 5 years, it is re-classified as culturable wasteland.
1.1 Why land-use changes over time
An economy affects its own land-use in three ways:
The economy grows
Population, income and technology grow together, so pressure on land increases and even marginal land comes into use.
Its composition changes
Secondary and tertiary sectors grow faster than agriculture, so land shifts gradually from agricultural to non-agricultural use, sharply so around large cities.
Pressure on farmland stays
Agriculture’s share of the economy falls, but the pressure on agricultural land does not: the population depending on it declines much more slowly, and it must feed more people every year.
2Land-Use Change (1950-51 to 2019-20) and Common Property Resources
Since the reporting area has stayed roughly constant, a fall in one category has usually meant a rise in another. Five categories increased and four declined.
| Land-use category | 1950-51 (%) | 2019-20 (%) | Trend |
|---|---|---|---|
| Forests | 17.0 | 23.4 | Increased |
| Non-agricultural uses | 3.2 | 9.1 | Increased (fastest rate) |
| Barren and wasteland | 13.4 | 5.4 | Declined |
| Permanent pasture and grazing land | 2.3 | 3.4 | Increased |
| Area under tree crops and groves | 6.9 | 1.0 | Declined |
| Culturable wasteland | 8.0 | 3.9 | Declined |
| Fallow other than current fallow | 6.1 | 3.7 | Declined |
| Current fallow | 3.7 | 4.5 | Increased |
| Net area sown | 41.7 | 45.6 | Increased |
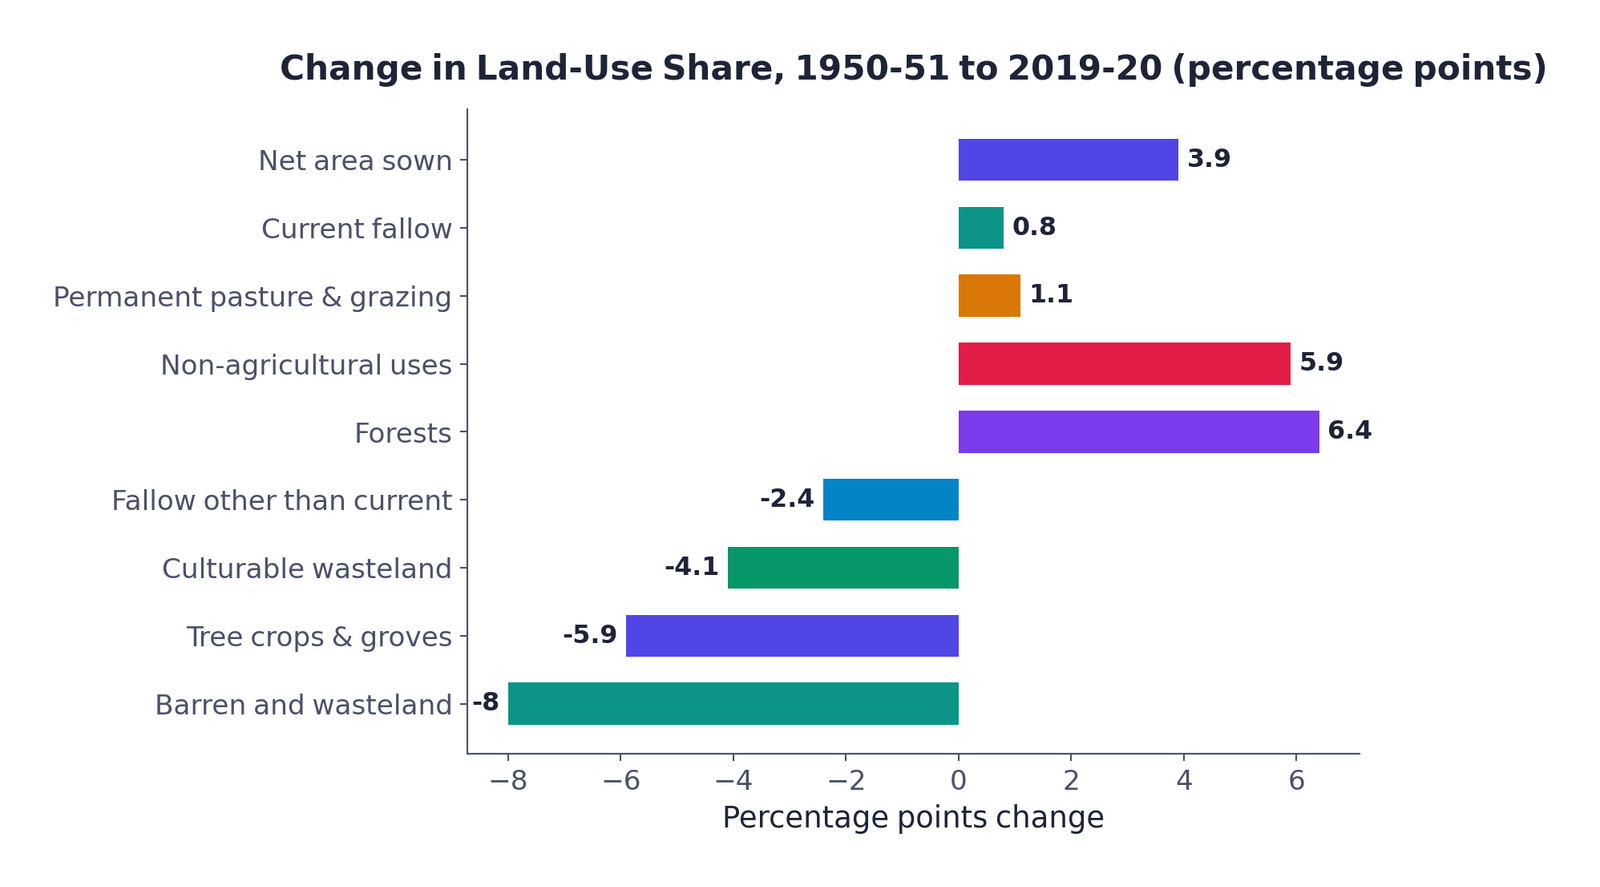
Learn this as “5 up, 4 down”: forest, non-agricultural use, permanent pasture & grazing, current fallow, net sown area went up; barren & wasteland, culturable wasteland, tree crops & groves, fallow-other-than-current went down.
Non-agricultural use rose fastest
Because of India’s shift toward industry and services, and the expansion of urban and rural settlements.
Forest share rose on paper
Mostly from a larger demarcated area, not necessarily a real increase in forest cover.
Current fallow fluctuates
It cannot be explained from just two data points; it depends on yearly rainfall and cropping cycles.
Net sown area rose recently
Mainly because culturable wasteland is now being brought under the plough; earlier it was slowly declining.
2.1 Common Property Resources (CPRs)
A Common Property Resource (CPR) is a community’s natural resource where every member has the right of access and usage, with specified obligations, but nobody holds individual property rights over it, e.g. community forests, pasture lands, village water bodies and other public spaces.
Land, by ownership, is either private land (owned by an individual or group) or a CPR (owned by the state, for community use). CPRs supply fodder, fuelwood and minor forest produce such as fruits, nuts, fibre and medicinal plants.
For the landless and marginal farmers
Many depend on income from livestock, for which CPRs provide fodder; this matters most where they have limited access to their own land.
For women
Fodder and fuelwood collection in rural areas is mostly done by women; a shrinking CPR forces them to travel further for both.
3Agricultural Land Use, Cultivable Land and Cropping Intensity
Land resources matter more to people who depend on agriculture for three reasons:
Agriculture is purely land-based
Unlike secondary or tertiary work, land contributes more directly to output, so lack of access to land is directly linked to rural poverty.
Land quality drives productivity
The quality of land has a direct bearing on agricultural output, which is not true of most other activities.
Land ownership has social value too
It secures credit and protects against hazards, and it adds to social status in rural areas.
3.1 Total cultivable land
Total cultivable land = Net sown area + all fallow lands + culturable wasteland.
| Category | % of reporting area | % of total cultivable land | ||
|---|---|---|---|---|
| 1950-51 | 2019-20 | 1950-51 | 2019-20 | |
| Culturable wasteland | 8.0 | 3.9 | 13.4 | 6.8 |
| Fallow other than current fallow | 6.1 | 3.7 | 10.2 | 6.4 |
| Current fallow | 3.7 | 4.5 | 6.2 | 7.8 |
| Net area sown | 41.7 | 45.6 | 70.0 | 79.0 |
| Total cultivable land | 59.5 | 57.7 | 100.0 | 100.0 |
Total cultivable land has declined only marginally, but cultivated land has declined by more, even though culturable wasteland also declined, so the scope for adding new net sown area in India is limited.
3.2 Cropping intensity
Since India is land-scarce but labour-abundant, raising the total output per unit area from all crops (not just the yield of one crop) is the better land-saving strategy, because it also raises the demand for labour.
3.3 Cropping seasons
Northern and interior India has three distinct cropping seasons. Southern India has no such sharp distinction: with enough soil moisture, the same crop can be grown up to three times a year.
| Season | Major crops (northern states) | Major crops (southern states) |
|---|---|---|
| Kharif (Jun-Sep) | Rice, cotton, bajra, maize, jowar, tur | Rice, maize, ragi, jowar, groundnut |
| Rabi (Oct-Mar) | Wheat, gram, rapeseed & mustard, barley | Rice, maize, ragi, groundnut |
| Zaid (Apr-Jun) | Vegetables, fruits, fodder | Rice, vegetables, fodder |
3.4 Types of farming
Farming is classified by its main source of moisture: irrigated or rainfed (barani).
Dryland farming (ragi, bajra, moong, gram, guar) is largely confined to areas with less than 75 cm annual rainfall. Wetland farming grows water-intensive crops such as rice, jute and sugarcane, and also supports freshwater aquaculture.
4India’s Major Crops
Foodgrains occupy about two-thirds of India’s total cropped area, and split into cereals and pulses by grain structure.
4.1 Cereals (about 54% of total cropped area)
India produces about 11% of the world’s cereals, ranking third after China and the USA. Cereals are fine grains (rice, wheat) or coarse grains (jowar, bajra, maize, ragi).
| Cereal | Season & conditions | % of cropped area | Leading states | World rank / share |
|---|---|---|---|---|
| Rice | Tropical, humid; grown sea-level to 2,000 m; kharif in the north, up to 3 crops/yr in the south & West Bengal (aus, aman, boro) | ~25% | West Bengal, Uttar Pradesh, Punjab | 22.07% of world output, rank 2 after China (2018) |
| Wheat | Temperate; rabi crop; mostly irrigated, rainfed in Himalayan highlands & Malwa (MP) | ~14% | Uttar Pradesh, Madhya Pradesh, Punjab, Haryana, Rajasthan | 12.8% of world output (2017) |
| Jowar | Semi-arid central & south India; kharif+rabi in south, kharif fodder crop in north | ~5.3% | Maharashtra (>half national output), Karnataka, MP, AP, Telangana | n/a |
| Bajra | Hot, dry NW/west India; hardy, drought-resistant; sole or mixed cropping | ~5.2% | Rajasthan, Maharashtra, Gujarat, UP, Haryana | n/a |
| Maize | Food + fodder; semi-arid, inferior soils; grown almost everywhere except Punjab and the NE | ~3.6% | Karnataka, MP, Bihar, AP, Telangana, Rajasthan, UP | n/a |
Punjab and Haryana are not traditional rice-growing states: rice was introduced there only in the 1970s, after the Green Revolution. This exact fact has been asked before.
4.2 Pulses (about 11% of total cropped area)
Pulses are legumes, rich in protein, and fix nitrogen in the soil naturally. India is the world’s leading producer, but yields are low and fluctuate because pulses are mostly rainfed drylands crops.
| Pulse | Conditions | % of cropped area | Leading states |
|---|---|---|---|
| Gram | Subtropical, rainfed rabi; needs only 1-2 light showers; displaced by wheat in Haryana, Punjab, north Rajasthan after the Green Revolution | ~2.8% | Madhya Pradesh, Uttar Pradesh, Maharashtra, AP, Telangana, Rajasthan |
| Tur (Arhar / red gram / pigeon pea) | Marginal lands, rainfed, dry central & southern India | ~2% | Maharashtra (~1/3 of national output), UP, Karnataka, Gujarat, MP |
4.3 Oilseeds (about 14% of total cropped area)
| Oilseed | Conditions | % of cropped area | Leading states |
|---|---|---|---|
| Groundnut | Mainly rainfed kharif of drylands; rabi too, in the south | ~3.6% | Gujarat, Rajasthan, Tamil Nadu, Telangana, AP, Karnataka, Maharashtra |
| Rapeseed & mustard | Includes rai, sarson, toria, taramira; subtropical, rabi; frost-sensitive | ~2.5% | Rajasthan (~1/3 of national output), Haryana, Madhya Pradesh |
| Soyabean | n/a | n/a | Madhya Pradesh and Maharashtra together give ~90% of national output |
| Sunflower | Minor crop in the north, where irrigation gives it a high yield | n/a | Karnataka, AP, Telangana, adjoining Maharashtra |
India produces 18.8% of the world’s groundnut (2018). Regions growing oilseeds include the Malwa plateau, Marathwada, Gujarat, Rajasthan, Telangana, Rayalseema (AP) and the Karnataka plateau.
4.4 Fibre crops
| Crop | Conditions | % of cropped area | Leading states | World share |
|---|---|---|---|---|
| Cotton | Tropical, kharif, semi-arid; short-staple (Indian) & long-staple (‘narma’, American) types; needs a clear sky at flowering | ~4.7% | Gujarat, Maharashtra, Telangana, AP, Punjab, Haryana | Rank 2 after China |
| Jute | Cash crop of West Bengal and the adjoining east; India lost large jute tracts to East Pakistan (Bangladesh) at Partition | ~0.5% | West Bengal (~3/4 of national output), Bihar, Assam | ~60% (3/5) of world output |
4.5 Other important crops
| Crop | Conditions | % of cropped area | Leading states | World share |
|---|---|---|---|---|
| Sugarcane | Tropical; largely irrigated in India, unlike rainfed elsewhere | ~2.4% | Uttar Pradesh (~40% of national output), Maharashtra, Karnataka, Tamil Nadu, AP | Rank 2 after Brazil (2018), ~19.7% of world output |
| Tea | Plantation crop; undulating hilly land, well-drained soil, humid/sub-humid tropics; began 1840s in the Brahmaputra valley, Assam | n/a | Assam (>half of national output), West Bengal, Tamil Nadu | ~21.22% of world output (2018), rank 2 exporter after China |
| Coffee | Tropical plantation crop; three varieties, namely arabica, robusta and liberica; India mostly grows superior arabica | n/a | Karnataka (>2/3 of national output), Kerala, Tamil Nadu | ~3.17% of world output, rank 8 (2018) |
India lost a large share of its cotton-growing area to Pakistan and its jute-growing area to East Pakistan (now Bangladesh) at Partition; both crops still bear the mark of that division in how they are distributed today.
5Agricultural Development in India
High Yielding Varieties (HYVs) are improved seed varieties, of wheat from Mexico and rice from the Philippines, that, combined with chemical fertilisers and assured irrigation, produced the rapid growth in foodgrain output known as the Green Revolution.
5.1 Growth in output and technology (last 50 years)
Pesticide use has also grown significantly since the 1960s, because HYVs are far more susceptible to pests and diseases than older varieties.
The Farmer’s Portal of India gives farmers a single platform for information on insurance, storage, crops, seeds, pesticides, machinery, market prices and welfare schemes, including an interactive map with block-level details on soil fertility, storage and training.
6Problems of Indian Agriculture
Most agricultural problems are region-specific, but eight are common across the country, from physical constraints to institutional hindrances.
Dependence on erratic monsoon
Irrigation covers only about 33% of cultivated area; the rest depends directly on rain. Poor monsoon years and drought-prone regions like Rajasthan face both drought and flash floods (as in Maharashtra, Gujarat and Rajasthan in 2006 and 2017).
Low productivity
Yields of rice, wheat, cotton and oilseeds are much lower than in the USA, Russia or Japan, largely because of very high pressure on land.
Financial constraints and indebtedness
Modern inputs are expensive; marginal and small farmers have little or no savings, so they borrow from institutions and moneylenders; crop failure then traps them in debt.
Lack of land reforms
Unequal land distribution under the colonial-era Mahalwari, Ryotwari and Zamindari systems (Zamindari the most exploitative) was never fully corrected after Independence, due to weak political will.
Small, fragmented holdings
Average holding size keeps shrinking under population pressure, and repeated division across generations fragments land further; small, scattered holdings are uneconomic.
Lack of commercialisation
Many small and marginal farmers grow only enough foodgrain for their own family; commercial, modernised farming is mostly confined to irrigated areas.
Vast underemployment
Especially in unirrigated tracts, seasonal unemployment runs 4 to 8 months, because farm operations are not labour-intensive throughout the year.
Degradation of cultivable land
Alkalisation, salinisation and waterlogging from faulty irrigation, plus excess pesticide use and multiple cropping that disrupts natural nitrogen fixation; all of this lowers soil fertility, especially in irrigated tracts.
The book raises farmers’ indebtedness and farmer suicides as a reflection question, not as a stated cause-and-effect fact. If asked to discuss it, treat it as “indebtedness is one linked factor,” not “indebtedness causes suicides”; do not overstate the book’s own claim.
- Nine land-use categories add up to the reporting area, not the geographical area
- 5 categories increased (1950-51 → 2019-20): forest, non-agricultural use, permanent pasture & grazing, current fallow, net sown area. 4 declined: barren & wasteland, culturable wasteland, tree crops & groves, fallow-other-than-current
- CPRs matter most to the landless, marginal farmers and rural women
- Total cultivable land = Net sown area + all fallow + culturable wasteland
- Cropping Intensity (%) = (GCA ÷ NSA) × 100
- Kharif (Jun-Sep), Rabi (Oct-Mar), Zaid (Apr-Jun): the three seasons apply only in northern and interior India
- Farming types: irrigated (protective / productive) and rainfed (dryland / wetland)
- Foodgrains = ~2/3 of cropped area; cereals ~54%, pulses ~11%; oilseeds ~14%
- Rice, wheat = leading cereals; gram, tur = leading pulses; groundnut, rapeseed & mustard = leading oilseeds; cotton, jute = fibre crops; sugarcane, tea, coffee = other major crops
- Green Revolution (mid-1960s): HYVs + fertilisers + assured irrigation, initially confined to irrigated areas
- Eight problems: erratic monsoon, low productivity, indebtedness, no land reforms, fragmented holdings, no commercialisation, underemployment, land degradation
- 1 markWhich one of the following is NOT a land-use category?
(a) Fallow land(b) Marginal land(c) Net area sown(d) Culturable wasteland - 1 markWhat is the main reason the share of forest area has increased in the last forty years?
(a) Extensive and efficient afforestation efforts(b) Increase in community forest land(c) Increase in the notified area for forest growth(d) Better people’s participation in forest management - 1 markWhich one of the following is the main form of degradation in irrigated areas?
(a) Gully erosion(b) Wind erosion(c) Salinisation of soils(d) Siltation of land - 1 markWhich one of the following crops is NOT cultivated under dryland farming?
(a) Ragi(b) Jowar(c) Groundnut(d) Sugarcane - 1 markIn which group of countries were HYVs of wheat and rice developed?
(a) Japan and Australia(b) USA and Japan(c) Mexico and Philippines(d) Mexico and Singapore - 1 markThe Green Revolution was initially confined to:
(a) rainfed areas only(b) hill states(c) irrigated areas only(d) coastal states - 1 markWhich of these pulses is also known as the “red gram” or “pigeon pea”?
(a) Gram(b) Tur(c) Moong(d) Urad - 1 markFallow land left uncultivated for more than five years is classified as:
(a) current fallow(b) barren land(c) culturable wasteland(d) net sown area
Reason (R): Rice cultivation was introduced in the irrigated areas of Punjab and Haryana only in the 1970s, following the Green Revolution.
Reason (R): Area classified as forest is the area the Government has demarcated for forest growth, which can rise without any real increase in tree cover.
Reason (R): Many landless and marginal households depend on income from livestock, for which CPRs provide fodder.
- 3 marksDifferentiate between barren and wasteland and culturable wasteland.
- 3 marksHow would you distinguish between net sown area and gross cropped area?
- 3 marksWhy is the strategy of increasing cropping intensity important in a country like India?
- 3 marksHow do you measure total cultivable land?
- 3 marksWhat is the difference between dryland and wetland farming?
- 3 marksWhat is the difference between protective and productive irrigation?
- 3 marksWhy do Punjab and Haryana, despite being major rice producers today, not count as traditional rice-growing states?
- 3 marksWhat are Common Property Resources, and why do they matter to rural women in particular?
- 5 marksWhat are the different types of environmental problems of land resources in India?
- 5 marksWhat are the important strategies for agricultural development followed in the post-Independence period in India?
- 5 marksDescribe the growing conditions, main producing states and the trend in yield for any two cereal crops of India.
- 5 marksExplain any four problems of Indian agriculture, with one example or figure for each.
- 1 markWhat type of farming is being practised in this district?
- 1 markName one other crop typically grown under this type of farming.
- 2 marksExplain in two points why farmers here rely on moisture conservation rather than canal irrigation.