- How to read and calculate population density, and why it is not the same as population distribution
- The geographical, economic and social factors that decide where people settle
- How to calculate the Crude Birth Rate and Crude Death Rate
- The difference between push and pull factors of migration
- The three stages of the Demographic Transition Theory, and where different countries sit on it today
- What family planning and Malthus’s theory say about controlling population growth
A country’s people are its real resource: they use the country’s land, water and minerals and decide how they are used. This chapter looks at how many people live where, how crowded different places are, and how population size changes over time.
1 Patterns of Population Distribution
Population distribution refers to the way people are spaced over the earth’s surface.
The world’s population is spread very unevenly. Broadly, about 90% of the world’s population lives on only about 10% of its land area. The 10 most populous countries of the world together hold about 60% of the world’s population, and 6 of these 10 countries are in Asia.
“Asia has many places where people are few and few places where people are very many.”
George B. Cressey, on the pattern of population distribution in Asia
2 Density of Population
Density of population is the ratio between the number of people and the size of the land they live on. It is usually measured in persons per sq km.
Given
Area of Region X = 100 sq km
Population of Region X = 1,50,000
Find
Density of population
Density = 1,50,000 ÷ 100 = 1,500 persons per sq km
A high figure like this tells us Region X is a densely populated area.
3 Factors Influencing the Distribution of Population
Three groups of factors decide where people choose to live.
3.1 Geographical factors
| Factor | How it affects settlement |
|---|---|
| Availability of water | People prefer areas with easy fresh water for drinking, cooking, cattle, crops, industry and navigation. River valleys are among the most densely populated areas in the world. |
| Landforms | Flat plains and gentle slopes suit farming, roads and industry, so they attract people. Mountains and hills hinder transport, farming and industry. The Ganga plains are densely populated; the Himalayan mountain zones are scarcely populated. |
| Climate | Very hot or very cold deserts are uncomfortable for people to live in. Areas with a comfortable, less-variable climate attract more people: Mediterranean regions have been settled since early history because of their pleasant climate. |
| Soils | Fertile, loamy soils support intensive agriculture, so areas with good soil carry more people than areas with poor soil. |
3.2 Economic factors
| Factor | How it affects settlement |
|---|---|
| Minerals | Areas with mineral deposits attract mining and industry, which need skilled and semi-skilled workers. Example: the Katanga-Zambia copper belt in Africa. |
| Urbanisation | Cities offer better jobs, education, medical facilities, transport and civic amenities, so people move from rural to urban areas and cities grow. Mega cities keep attracting large numbers of migrants every year. |
| Industrialisation | Industrial belts create jobs not just for factory workers but also transport operators, shopkeepers, bank employees, doctors and teachers. Example: the Kobe-Osaka region of Japan, densely populated because of its many industries. |
3.3 Social and cultural factors
Some places attract more people because of religious or cultural significance. In the same way, people move away from places with social or political unrest. Governments sometimes offer incentives to people to settle in sparsely populated areas, or to move away from overcrowded places.
“Discuss the factors influencing distribution and density of population” is a common 4/6-mark question. Answer it in exactly these three headed groups: Geographical, Economic, and Social and cultural, with one example under each, rather than as one long paragraph.
4 Population Growth
Population growth (or population change) is the change in the number of inhabitants of a territory during a specific period of time. It can be positive or negative, and is expressed either as an absolute number or as a percentage.
Population change is an important indicator of a region’s economic development, social upliftment, and historical and cultural background.
4.1 Six basic concepts of population geography
| Term | Meaning |
|---|---|
| Growth of Population | Change of population in a particular area between two points of time. Example: India’s population was 102.70 crore in 2001 and 121.02 crore in 2011: the growth was 18.15 crore. |
| Growth Rate of Population | The same change in population, but expressed as a percentage. |
| Natural Growth of Population | Births minus Deaths, in a particular region between two points of time. |
| Actual Growth of Population | Births − Deaths + In-migration − Out-migration. |
| Positive Growth of Population | When birth rate is more than death rate between two points of time, or people migrate permanently into a region. |
| Negative Growth of Population | When population decreases between two points of time: birth rate falls below death rate, or people migrate to other countries. |
5 Components of Population Change
There are three components of population change: births, deaths and migration.
Mortality (death rate) plays an active role in population change: growth occurs from a rising birth rate as well as a falling death rate. CDR is affected by a region’s demographic structure, social advancement and level of economic development.
6 Migration
The place people move away from is the Place of Origin (its population decreases); the place they move to is the Place of Destination (its population increases).
Immigration
- Migrants who move into a new place
- Called Immigrants
Emigration
- Migrants who move out of a place
- Called Emigrants
Migration may be permanent, temporary or seasonal, and can take place rural-to-rural, rural-to-urban, urban-to-urban, or urban-to-rural. The same person is both an immigrant (at the destination) and an emigrant (from the origin).
Push factors: origin becomes less attractive
- Unemployment, poor living conditions
- Political turmoil, unpleasant climate
- Natural disasters, epidemics
- Socio-economic backwardness
Pull factors: destination becomes more attractive
- Better job opportunities
- Better living conditions, medical/educational facilities
- Peace and stability
- Security of life and property, pleasant climate
Do not swap push and pull factors. Push factors are about the place left behind; pull factors are about the place moved to. “Medical/educational facilities” is a pull factor, not a push factor, a frequent MCQ trap.
7 Demographic Transition Theory
The Demographic Transition Theory describes and predicts the future population of a region. It says that a region’s population changes from high births and high deaths to low births and low deaths as society moves from rural, agrarian and illiterate to urban, industrial and literate. This change happens in stages, together called the demographic cycle.
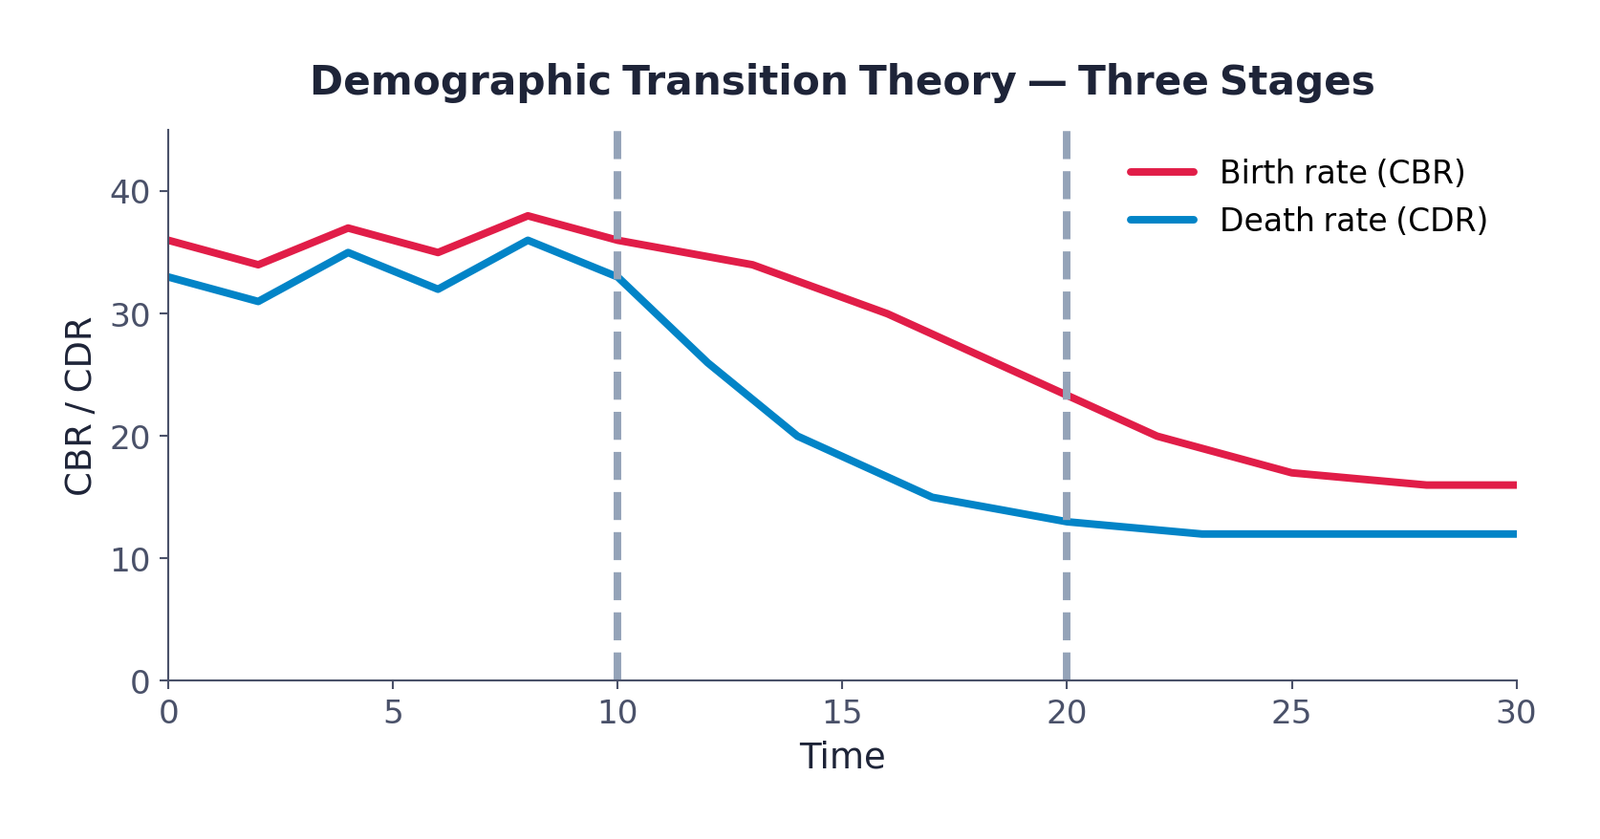
The NCERT chapter’s own figure places example countries against these three stages: present-day rainforest tribes, Bangladesh and Peru are shown near Stage I; Kenya and Sri Lanka near Stage II; Canada, Japan and the USA near Stage III.
High Fluctuating Stage
High fertility and high mortality, so growth is slow. People reproduce more to make up for deaths from epidemics and uncertain food supply. Most people farm; large families are seen as an asset. Life expectancy is low, most people are illiterate, and technology is limited. Every country in the world was in this stage 200 years ago.
Expanding Stage
Fertility stays high at first but declines with time, while mortality falls faster due to better sanitation and health. Because of this gap, the net addition to population is high: this is the stage of fastest population growth.
Low Fluctuating Stage
Both fertility and mortality decline considerably. Population becomes stable or grows slowly. Society is urbanised, literate, technically skilled, and deliberately controls family size.
A very common “not a fact” MCQ trap: population growth is slow in Stage I, not high: both birth and death rates are high, so they cancel each other out. The fastest growth is in Stage II, where death rate has fallen but birth rate has not.
Different countries today sit at different stages of the demographic transition. This shows that human beings can flexibly adjust their fertility as their society develops.
8 Population Control Measures
Family planning is the spacing or preventing of the birth of children. Access to family planning services helps limit population growth and improves women’s health.
Propaganda, free availability of contraceptives, and tax disincentives for large families are measures that can help control population.
Thomas Malthus’s theory (1798) stated that population would increase faster than food supply. Any further increase would cause a population crash through famine, disease and war. Preventive checks (like family planning) are better than these physical checks. The world must control rapid population growth to keep its resources sustainable.
- Population distribution = how people are spaced; density = people ÷ area
- 90% of world population lives on 10% of world land; top 10 countries hold 60% of world population, 6 in Asia
- Three groups of factors decide distribution: Geographical (water, landforms, climate, soils), Economic (minerals, urbanisation, industrialisation), Social and cultural
- Population growth = change in number of people over a period; can be positive or negative
- Natural Growth = Births − Deaths; Actual Growth = Births − Deaths + In-migration − Out-migration
- CBR = (B/P) × 1000; CDR = (D/P) × 1000
- Migration: place of origin loses population, place of destination gains it; push factors repel, pull factors attract
- Demographic Transition: Stage I slow growth (high birth & death), Stage II fastest growth (death rate falls first), Stage III slow/stable growth (both rates low)
- Family planning and Malthus’s 1798 theory are the two population-control ideas in this chapter
- 1 markWhich one of the following continents has the highest growth of population?
(a) Africa(b) South America(c) Asia(d) North America - 1 markWhich one of the following is NOT an area of sparse population?
(a) The Atacama(b) South-east Asia(c) Equatorial region(d) Polar regions - 1 markWhich one of the following is NOT a push factor of migration?
(a) Water shortage(b) Medical/educational facilities(c) Unemployment(d) Epidemics - 1 markWhich one of the following statements is NOT a fact?
(a) Human population increased more than ten times in the past 500 years(b) Population took 100 years to grow from 5 billion to 6 billion(c) Population growth is high in the first stage of demographic transition - 1 markThe ratio between the number of people and the size of land they live on is called:
(a) Population distribution(b) Population density(c) Population growth(d) Natural growth - 1 markAbout what percentage of the world’s population lives on about 10% of its land area?
(a) 60%(b) 75%(c) 90%(d) 50% - 1 markOf the 10 most populous countries of the world, how many are located in Asia?
(a) 4(b) 5(c) 6(d) 8 - 1 markThe Katanga-Zambia copper belt is an example of which factor influencing population distribution?
(a) Climate(b) Minerals(c) Soils(d) Urbanisation - 1 markCDR stands for:
(a) Crude Density Rate(b) Crude Death Rate(c) Cumulative Death Rate(d) Crude Destination Rate - 1 markIn which stage of the demographic transition is the net addition to population the highest?
(a) Stage I(b) Stage II(c) Stage III(d) It stays constant across all stages - 1 markWho proposed that population would increase faster than food supply?
(a) George B. Cressey(b) Thomas Malthus(c) Ralph Waldo Emerson(d) Charles Darwin - 1 markA migrant who moves out of a place is called:
(a) An immigrant(b) A native(c) An emigrant(d) A settler
- 1 mark
Assertion (A): The Ganga plains are among the most densely populated areas of the world.
Reason (R): Flat, fertile plains with abundant water favour agriculture and are easier to build roads and industries on.(a) Both A and R are true, and R is the correct explanation of A(b) Both A and R are true, but R is not the correct explanation of A(c) A is true, but R is false(d) A is false, but R is true
- 1 mark
Assertion (A): Population growth in Stage II of the demographic transition is the fastest of all three stages.
Reason (R): In Stage II, the death rate falls faster than the birth rate, widening the gap between births and deaths.(a) Both A and R are true, and R is the correct explanation of A(b) Both A and R are true, but R is not the correct explanation of A(c) A is true, but R is false(d) A is false, but R is true
- 1 mark
Assertion (A): Medical and educational facilities are counted as a push factor of migration.
Reason (R): Good facilities at a destination make it more attractive to migrants, which is what defines a pull factor.(a) Both A and R are true, and R is the correct explanation of A(b) Both A and R are true, but R is not the correct explanation of A(c) A is true, but R is false(d) A is false, but R is true
- 1 markDefine population density.
- 1 markWhat is meant by the “place of destination” in migration?
- 1 markName the theory that predicts the future population of a region.
- 1 markIn which year did Thomas Malthus present his theory on population and food supply?
- 3 marksName three geographical factors that influence the distribution of population.
- 3 marksThere are a number of areas with high population density in the world. Why does this happen?
- 3 marksWhat are the three components of population change?
- 2 marksDistinguish between birth rate and death rate.
- 2 marksDistinguish between push factors and pull factors of migration.
- 3 marksCalculate the density of population of a region with an area of 250 sq km and a population of 5,00,000.
- 2 marksDistinguish between natural growth and actual growth of population.
- 3 marksWhy are river valleys among the most densely populated areas of the world?
- 2 marksWhat is positive growth of population? Give one reason for it.
- 2 marksWhat is negative growth of population? Give one reason for it.
- 6 marksDiscuss the factors influencing the distribution and density of population in the world.
- 6 marksDiscuss the three stages of demographic transition.
- 4 marksExplain the economic factors that influence the distribution of population, with one example each.
- 4 marksWhat is migration? Explain push and pull factors with examples.
- 4 marksExplain the concepts of Crude Birth Rate and Crude Death Rate with their formulas.
- 4 marksWhat measures can be adopted to control population growth?