
Exam-useful questions from this chapter, grouped by marks, each with a full model answer. Try writing the answer yourself first, then check it against this one.
1 1-Mark Questions
Q. What is meant by ‘representation of data’?
Answer: The transformation of data through visual methods like graphs, diagrams, maps and charts is called representation of data.
Q. Define a polygraph.
Answer: A polygraph is a line graph in which two or more than two variables are shown by an equal number of lines, for an immediate comparison.
Q. What is the pie diagram also known as?
Answer: The pie diagram is also known as a Divided Circle Diagram.
Q. What is a flow chart also known as?
Answer: A flow chart is also known as a Dynamic Map.
Q. State the formula used to calculate the interval between choropleth categories.
Answer: The interval is calculated as Range ÷ 5, where Range = Maximum value − Minimum value.
Q. What do ‘Iso’ and ‘pleth’ mean in the term Isopleth?
Answer: ‘Iso’ means equal and ‘pleth’ means lines; an Isopleth is an imaginary line joining places of equal value.
Q. Name the three general rules for drawing graphs, diagrams and maps.
Answer: The three general rules are: selection of a suitable method, selection of a suitable scale, and design.
Q. What does a choropleth map represent?
Answer: A choropleth map represents data related to administrative units, such as density of population, literacy or growth rates, and sex ratio.
2 2-Mark Questions
Q. Differentiate between a multiple bar diagram and a compound bar diagram.
Answer: A multiple bar diagram is constructed to represent two or more variables for comparison, with each variable shown as a separate, adjacent bar. A compound bar diagram, by contrast, shows the different components of one variable (or different variables of one component) as segments within a single bar.
Q. What are the requirements for constructing a dot map?
Answer: A dot map needs: an administrative map of the area showing state/district/block boundaries; statistical data on the selected theme for those units; a scale to determine the value of a dot; and a physiographic map of the region, especially its relief and drainage.
Q. State the formula for calculating a pie-diagram angle from percentage data, and explain each term.
Answer: Angle = Percentage of x × 360 ÷ 100, which simplifies to Percentage × 3.6. Here, ‘Percentage of x’ is the given category’s share of the total (in %), and 3.6 is the constant obtained by dividing the total degrees in a circle (360) by 100.
Q. What precautions should be taken while constructing a pie diagram?
Answer: The circle should neither be too big to fit the space nor too small to be illegible; and angles should be measured ascending, starting with the smallest, since starting with a bigger angle first accumulates error and makes the smallest angle difficult to plot accurately.
Q. What is the difference between quantitative and non-quantitative thematic maps? Give one example of each.
Answer: Quantitative (statistical) maps show the actual variation within the data, such as areas receiving more than 200 cm, 100-200 cm, 50-100 cm and less than 50 cm of rainfall. Non-quantitative (qualitative) maps show only non-measurable characteristics, such as a map that simply marks ‘high rainfall’ and ‘low rainfall’ areas without exact bands.
Q. List the three components of ‘Design’ in cartographic construction and state where each is usually placed.
Answer: Title (name of the area, reference year and caption) is usually shown at the centre top of the map/diagram; Legend/Index (explaining colours, shades and symbols) is usually shown at the lower left or lower right; Direction (the north symbol) is shown since a map represents part of the earth’s surface and must be oriented.
Q. Using the chapter’s own formula, calculate the pie-diagram angle for a category that is 6.5% of the total value.
Answer: Angle = 6.5 × 3.6 = 23.4, which rounds to 23°. (This matches the book’s own Table 3.7(b) figure for Africa’s 6.5% share of India’s exports.)
Q. What two types of data does a flow map/chart represent?
Answer: A flow map represents: (1) the number and frequency of vehicles as per the direction of their movement, and (2) the number of passengers and/or the quantity of goods transported.
3 4-Mark Questions
Q. Describe the method (steps) of constructing a choropleth map, with the formula used.
Answer: First, the data for the chosen administrative units are arranged in ascending or descending order. Second, the data are grouped into five categories: very high, high, medium, low and very low. Third, the interval between categories is calculated using the formula Interval = Range ÷ 5, where Range = Maximum value − Minimum value; this interval is then added successively to the minimum value to fix each category’s boundary. Finally, shades or colours are assigned to the categories in increasing or decreasing order, and the map is completed with its administrative-unit boundaries.
Q. Explain the four construction steps of a line graph, and describe what precaution is taken if the data include negative values.
Answer: (a) The data are first simplified by converting them into round numbers, e.g. a growth rate of 1.96 may be rounded to 2.0. (b) The X and Y axes are drawn, with the time-series variable (years/months) marked on the X-axis and the data quantity on the Y-axis. (c) An appropriate scale is chosen and labelled on the Y-axis; if the data include a negative figure (as India’s population growth rate does for 1921), the selected scale must also show the negative range below zero, exactly as the book’s own Fig. 3.1 does. (d) The values are plotted as dots according to the scale and joined by a free-hand drawn line.
Q. Using the method of Example 3.10, calculate the number of dots required to represent a state with a 2001 population of 4,52,63,000, at a scale of 1 dot = 1,00,000 persons.
Answer: 45,263,000 ÷ 100,000 = 452.63. Since the fractional part (0.63) is more than 0.5, the book’s own rounding rule rounds this up, so the state would be represented by 453 dots.
Q. Name the eight commonly drawn isopleths described in this chapter, and state what each measures.
Answer: Isotherm (equal temperature), Isobar (equal pressure), Isohyet (equal rainfall), Isoneph (equal cloudiness), Isohel (equal sunshine), Contour (equal height), Isobath (equal depth), and Isohaline (equal salinity).
Q. Describe the requirements and rules for making a thematic map.
Answer: Requirements: state/district-level data on the selected theme; an outline map of the study area with administrative boundaries; and a physical map of the region (for example, a physiographic map for population distribution, or a relief-and-drainage map for a transportation map). Rules: the final map must be carefully planned to show the name of the area, the title of the subject-matter, the source of the data and its year, an indication of symbols/signs/colours/shades, and the scale; and a suitable method of thematic mapping must be selected for the data being shown.
Q. Using Example 3.7’s method, calculate the pie-diagram angle for a region contributing 34.5% to a total value, and explain why the book’s own worked calculation for ‘Asia and ASEAN’ (56.2%) needed an extra +1° adjustment.
Answer: 34.5 × 3.6 = 124.2, which rounds to 124°. In the book’s own Table 3.7(b), Asia and ASEAN’s share (56.2%) works out to 56.2 × 3.6 = 202.32, which strict rounding would give as 202°; but the book prints 203° instead. This is because the five angles must sum to exactly 360°: Europe (73°) + Africa (23°) + America (53°) + Others (8°) = 157°, leaving 360−157 = 203° for Asia and ASEAN. The book’s own printed ‘Calculation’ column still shows 202.32, but its ‘Degree’ column adjusts the largest category by +1° so the total comes to exactly 360°, rather than 359°.
Q. Construct a pie diagram to show India’s exports to major regions of the world, 2010-11 (Europe 20.2%, Africa 6.5%, America 14.8%, Asia & ASEAN 56.2%, Others 2.3%). Show the calculation of the angles.
Answer: Angles (data in percentage, so angle = percentage × 3.6): Others 2.3 × 3.6 = 8.3° (8°); Africa 6.5 × 3.6 = 23.4° (23°); America 14.8 × 3.6 = 53.3° (53°); Europe 20.2 × 3.6 = 72.7° (73°); Asia & ASEAN 56.2 × 3.6 = 202.3° (203°); total 360°. Construction: (a) choose a suitable radius (3, 4 or 5 cm) and draw the circle; (b) draw one radius from the centre to the arc as the starting line; (c) measure the angles clockwise in ascending order, starting with the smallest (Others 8°, then Africa, America, Europe), so that the largest sector, Asia & ASEAN, is what remains; (d) shade each sector differently and add the title, sub-title and legend.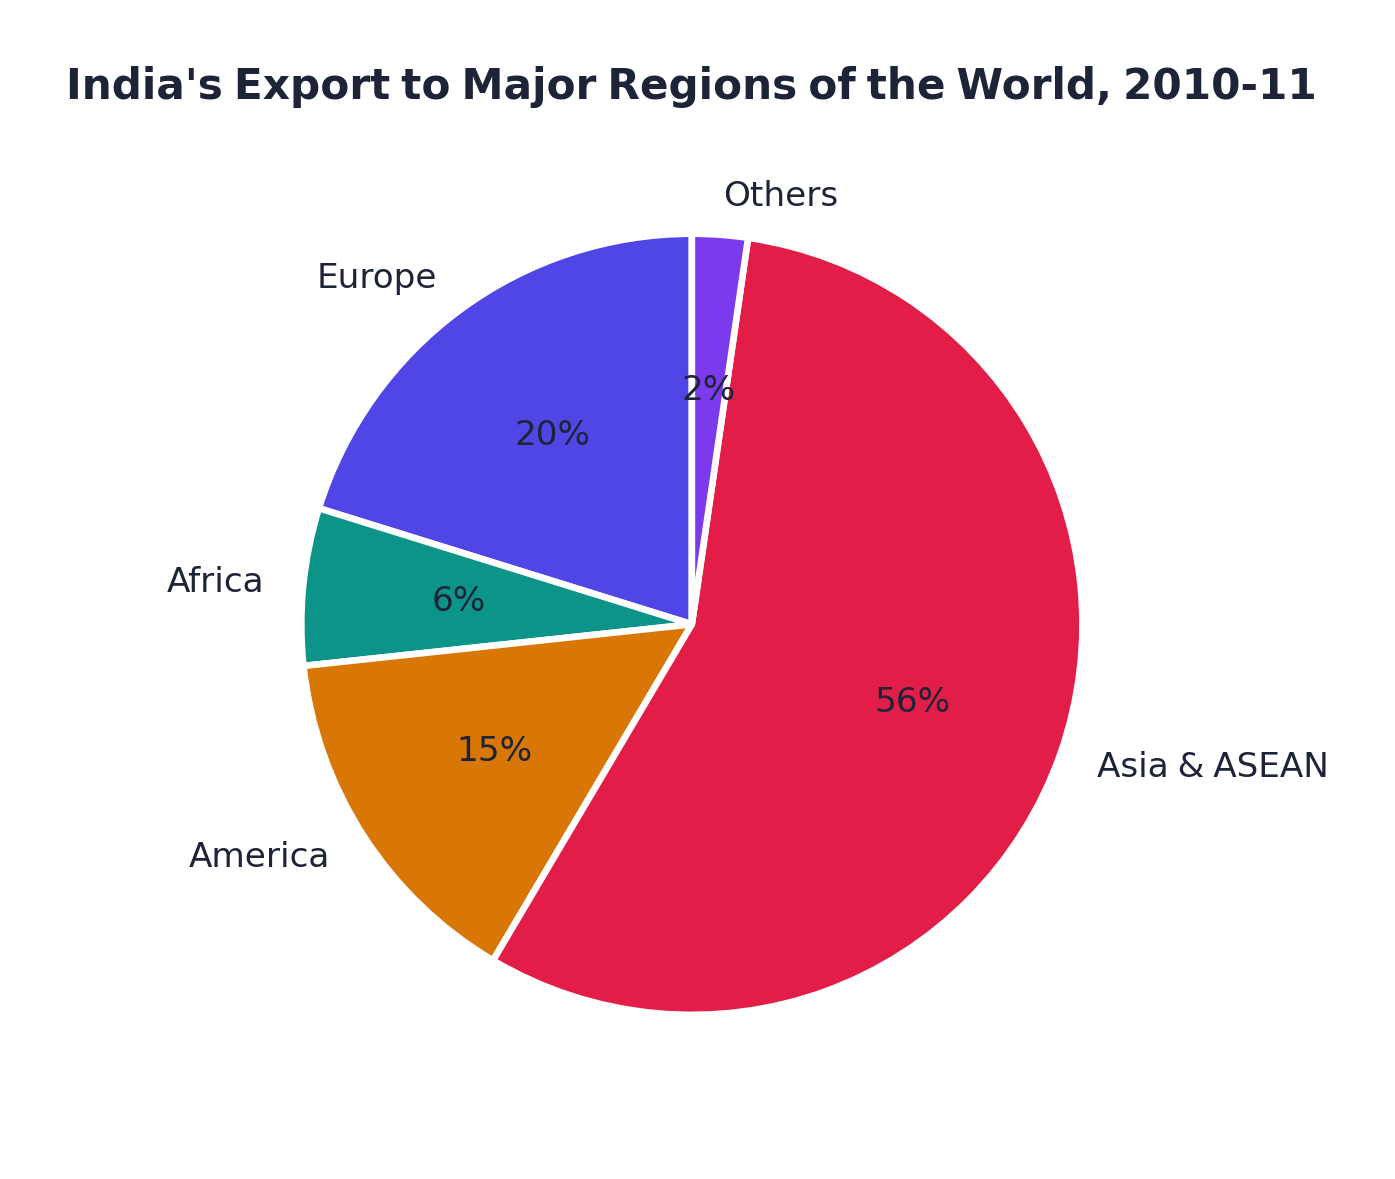 India’s exports to major regions of the world, 2010-11 (pie diagram)
4 6-Mark Questions
Q. Explain the classification of diagrams by dimension (one-, two- and three-dimensional), name at least two examples of each, and state which of these this chapter actually explains the construction of.
Answer: Diagrams are classified by dimension into three groups. One-dimensional diagrams include the line graph, poly graph, bar diagram, histogram, and age-sex pyramid. Two-dimensional diagrams include the pie diagram and the rectangular diagram. Three-dimensional diagrams include the cube diagram and the spherical diagram. Of all these, the chapter explains the construction of only a limited, ‘commonly drawn’ set: the line graph (and its polygraph variant), the bar diagram (simple, combined line-and-bar, multiple and compound), and the pie diagram, from the one/two-dimensional list, plus flow charts and, separately, the three thematic map types (dot, choropleth and isopleth). The wind rose and star diagram is named alongside these but never given a construction method; histograms, age-sex pyramids, rectangular, cube and spherical diagrams are named only in the classification and are not explained further in this chapter.
Q. With the help of the formula and a worked numerical example, explain how interpolation is used to draw an isopleth of a given value between two known points.
Answer: Interpolation is the method of inserting an intermediate value between two observed values or stations; drawing an isopleth joining places of the same value is itself called interpolation. The method has three steps: (a) find the minimum and maximum values on the map, (b) calculate the Range = Maximum − Minimum, and (c) fix a whole-number interval (5, 10, 15, etc.). The exact point of the isopleth is then found using the formula: Point of Isopleth = (Distance between two points in cm ÷ Difference between the two point values) × Interval. Worked example (from the chapter): two points on a map show 28°C and 33°C, and the 30°C isotherm is to be drawn between them. The distance between the two points is 1 cm (10 mm), and the difference between the values is 33−28 = 5. Since 30 is 2 points above 28, the isotherm is (10÷5)×2 = 4 mm away from the 28°C point. Since 30 is 3 points below 33, it is equally (10÷5)×3 = 6 mm away from the 33°C point. Both calculations agree (4 mm from one side and 6 mm from the other add up to the full 10 mm distance), confirming the isotherm’s position. The rule is to always draw the isopleth of the minimum value first.
Q. Describe, with the exact formula and a full worked recomputation, how a choropleth map’s five categories are derived from a set of literacy-rate data, using Table 3.10’s own figures (minimum 47.0, maximum used 91.0).
Answer: Step 1: arrange the literacy-rate data of all states/UTs in ascending order. Step 2: identify the minimum and maximum values: here, Bihar at 47.0% (minimum) and Kerala at 90.9%, which the book rounds up to 91.0 for this calculation (maximum). Step 3: calculate the Range = Maximum − Minimum = 91.0 − 47.0 = 44.0. Step 4: calculate the Interval = Range ÷ 5 = 44.0 ÷ 5 = 8.8, which the book converts to the round number 9.0. Step 5: build five categories by adding 9.0 successively to the minimum: 47-56 (Very low), 56-65 (Low), 65-74 (Medium), 74-83 (High), 83-92 (Very high). Step 6: every state/UT is placed in its band by its own literacy rate, and shades are assigned from lightest (very low) to darkest (very high), or vice versa, in a consistent increasing/decreasing order.
5 Case Studies
(A) 1 mark Calculate the pie-diagram angle for Africa’s share.
Answer: 6.5 × 3.6 = 23.4, which rounds to 23°.
(B) 1 mark Calculate the pie-diagram angle for America’s share.
Answer: 14.8 × 3.6 = 53.28, which rounds to 53°.
(C) 2 marks Calculate the pie-diagram angle for Asia and ASEAN’s share, and explain why the book rounds it to 203° instead of the strict calculator value.
Answer: 56.2 × 3.6 = 202.32, which strict rounding gives as 202°. But the book prints 203°, because the five angles (73°+23°+53°+?°+8°) must sum to exactly 360°: 360 − (73+23+53+8) = 203. The book adjusts the largest category by +1° so the pie diagram’s angles total exactly 360°, rather than the 359° that strict rounding of every value would give.
(A) 1 mark Calculate the number of dots for Bihar.
Answer: 82,878,796 ÷ 100,000 = 828.79, which rounds up to 829 dots (fraction > 0.5), matching the book’s own printed Table 3.9 value.
(B) 1 mark Calculate the number of dots for Kerala.
Answer: 31,838,619 ÷ 100,000 = 318.39, which rounds down to 318 dots (fraction < 0.5), matching the book's own printed Table 3.9 value.
(C) 2 marks State the rounding rule the book uses for the dot map, and verify that both your calculated dot-counts above match the book’s own printed Table 3.9 values.
Answer: The book’s rule (demonstrated for Maharashtra) is: round the calculated dot-count up if its fractional part is more than 0.5, and down if it is 0.5 or less. Applying this rule, Bihar’s 828.79 rounds up to 829, and Kerala’s 318.39 rounds down to 318, both exactly matching the book’s own printed Table 3.9 figures and confirming the calculation.