- What Spatial Information Technology and GIS actually mean, in the book’s own definitions
- The difference between spatial and non-spatial (attribute) data, and between raster and vector formats
- The five components of a GIS, and how spatial data is captured, entered, checked and converted
- How exact, hierarchical and fuzzy matching link different data files correctly
- What overlay analysis and buffer analysis do, with real examples of each
1 What is Spatial Information Technology?
Computers help us process data and draw graphs, diagrams and maps quickly. But maps and graphs made this way, on their own, cannot help someone actually decide what to do next. To answer real questions like “what is where?”, “why is it there?” and “what happens if it is moved?”, data from different sources has to be captured and combined using computers built for geo-processing. This is the idea behind a Spatial Information System.
The word spatial is derived from space. It refers to the features and phenomena distributed over a geographically definable space, having physically measurable dimensions.
Spatial Information Technology is the use of technological inputs in collecting, storing, retrieving, displaying, manipulating, managing and analysing spatial information. It is an amalgamation of Remote Sensing, GPS, GIS, Digital Cartography and Database Management Systems (DBMS).
Most data we use every day already has a spatial component, such as the address of a municipal facility or the boundary of an agricultural holding, even when we don’t think of it as “map data”.
2 What is GIS (Geographical Information System)?
Advanced computing systems, available since the mid-1970s, made it possible to process georeferenced information: organising spatial and attribute data, locating specific information in individual files, running computations and building a decision support system. A system capable of all this is called a Geographic Information System.
GIS is a system for capturing, storing, checking, integrating, manipulating, analysing and displaying data which are spatially referenced to the Earth. It normally involves a spatially referenced computer database and appropriate application software. GIS is an amalgamation of Computer Assisted Cartography and a Database Management System.
GIS draws its conceptual and methodological strength from several spatial and allied sciences:
3 Forms of Geographical Information
Two types of data represent geographical information: spatial data and non-spatial (attribute) data.
3.1 Spatial versus non-spatial data
Spatial data
- Has a definite location on the Earth
- Characterised by positional, linear and areal forms
- Example: the names of states, which have a fixed position on a map
Non-spatial (attribute) data
- Describes the properties of spatial data
- Not spatial itself, can belong anywhere
- Example: a cycle shop’s part number, quantity and description
A cycle shop’s stock register (part number, quantity, description) is non-spatial data, the parts could be anywhere. A table of literate population by state (1981) is spatial data, because each state named in it has a definite location on a map. This kind of spatially-located data can be used in a GIS.
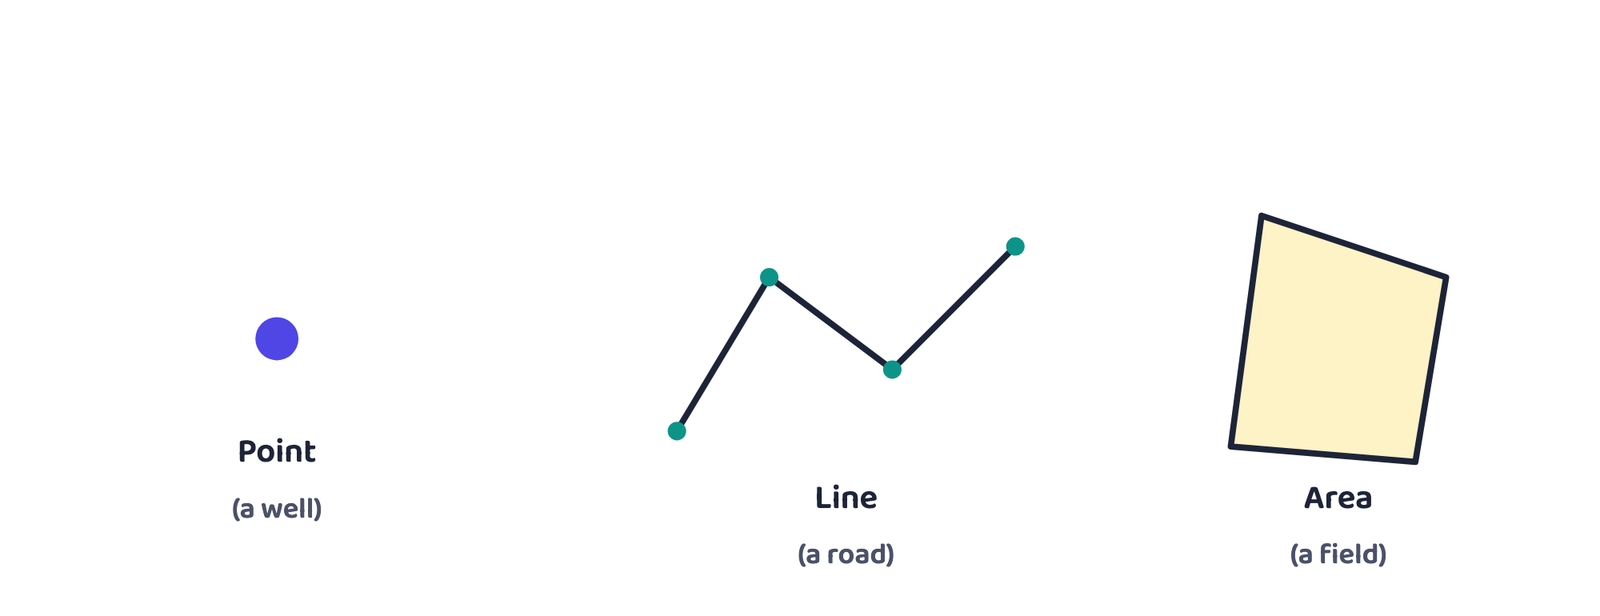
Such data must be registered to a properly defined coordinate system and coded so it can be stored in the GIS database.
3.2 Building a GIS database
Acquire from a supplier
Get ready-made digital data from an existing data supplier.
Digitise analogue data
Convert existing paper maps or records into digital form.
Own survey
Carry out a fresh geographic survey to collect the data directly.
The choice depends on the application area, the available budget, and the type of data structure needed (vector or raster). The most common source for most users is a topographical or thematic map, in hard copy (paper) or soft copy (digital) form. Every such map is defined by a definite scale, symbols and colours for the mapped attributes, and an agreed coordinate system.
4 GIS versus Manual Map Methods
A printed map is a fixed graphic. It has real limitations: it is processed and presented in only one particular way, it shows just one or a few predetermined themes, and any change to the information needs an entirely new map to be drawn.
1. Users can query displayed spatial features and retrieve their attribute information for analysis.
2. New maps can be drawn just by querying or analysing attribute data.
3. Spatial operations (overlay, buffering) can be applied to an integrated database to generate new information.
4. Different items of attribute data can be linked to one another through a shared location code.
5 Components of GIS
5.1 The five components
Hardware
Processing, storage, display, and input/output sub-systems.
Software
Modules for data entry, editing, maintenance, analysis, transformation, display and output.
Data
Spatial data and its related tabular (attribute) data, the backbone of a GIS.
People
From hardware/software engineers to resource scientists, policy-makers and monitoring agencies.
Procedures
How data is retrieved, entered, stored, managed, transformed, analysed and finally presented.
6 Spatial Data Formats: Raster and Vector
Spatial data is represented in two ways: raster and vector data formats.
Raster data represents a graphic feature as a pattern of grid cells (like squares on graph paper). Each cell is given a value based on the attribute at that position, and can be located by its row and column.
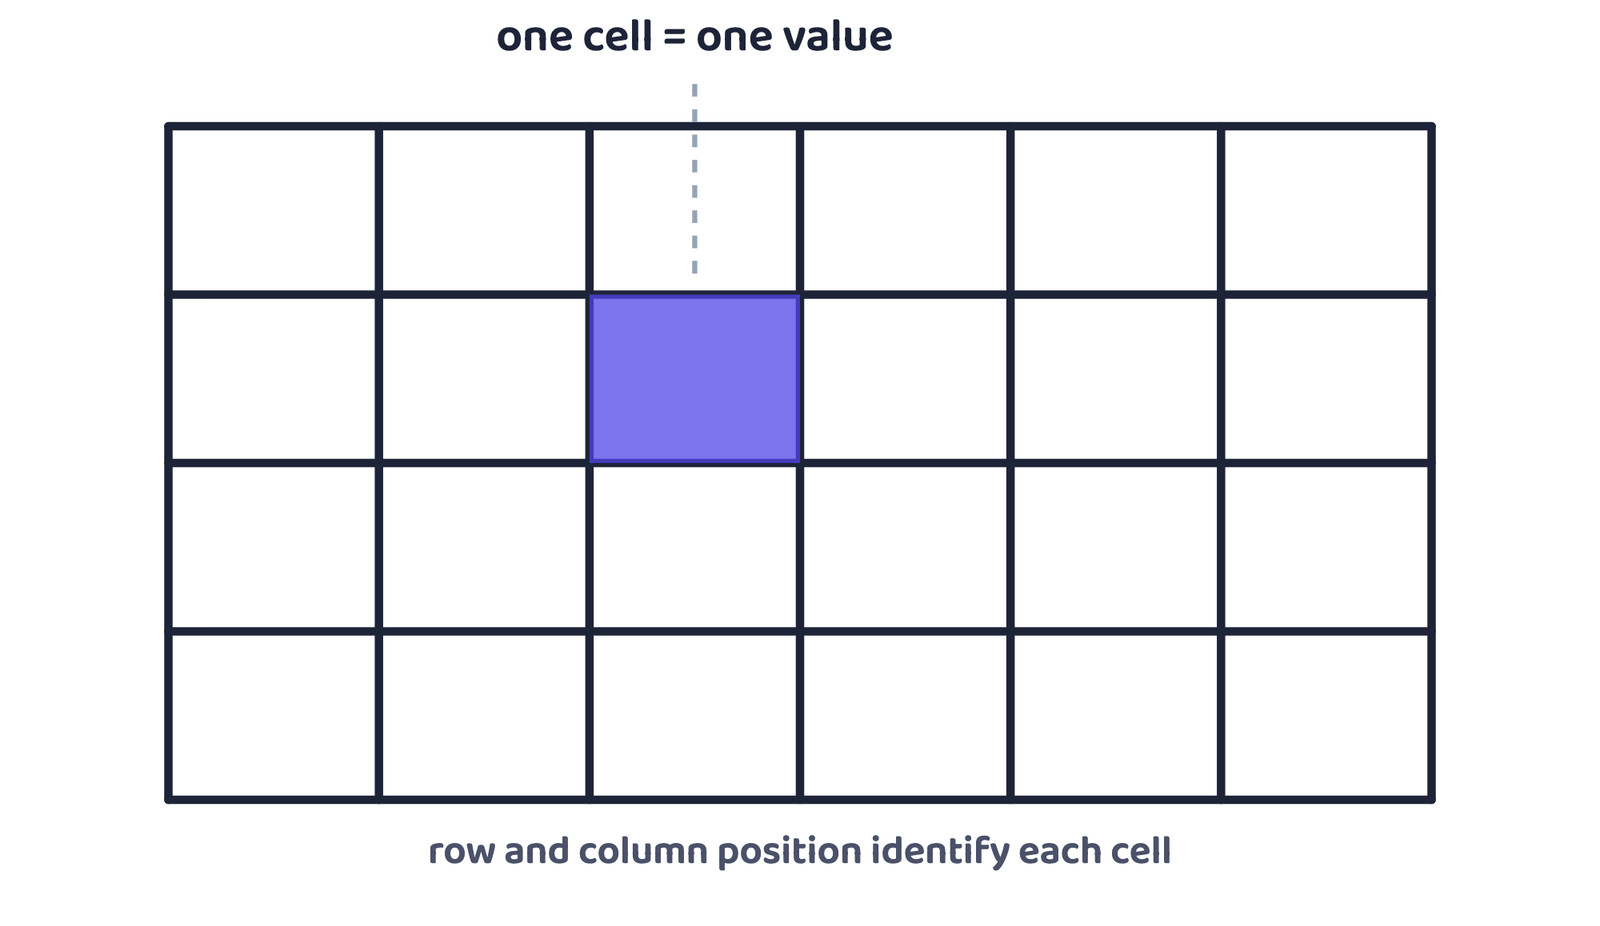
Resolution is the relationship between cell size and the number of cells: smaller cells give finer resolution but far more cells to store. Raster is best used for aerial photographs, satellite images and scanned paper maps; when costs must be kept low; when individual features don’t need separate analysis; and for “backdrop” maps.
Vector data represents an object as a set of lines drawn between specific points, recorded by their coordinates (X, Y or X, Y, Z). Lines have a direction to the order of their points; polygons are built from points or lines; vectors can also store topology.
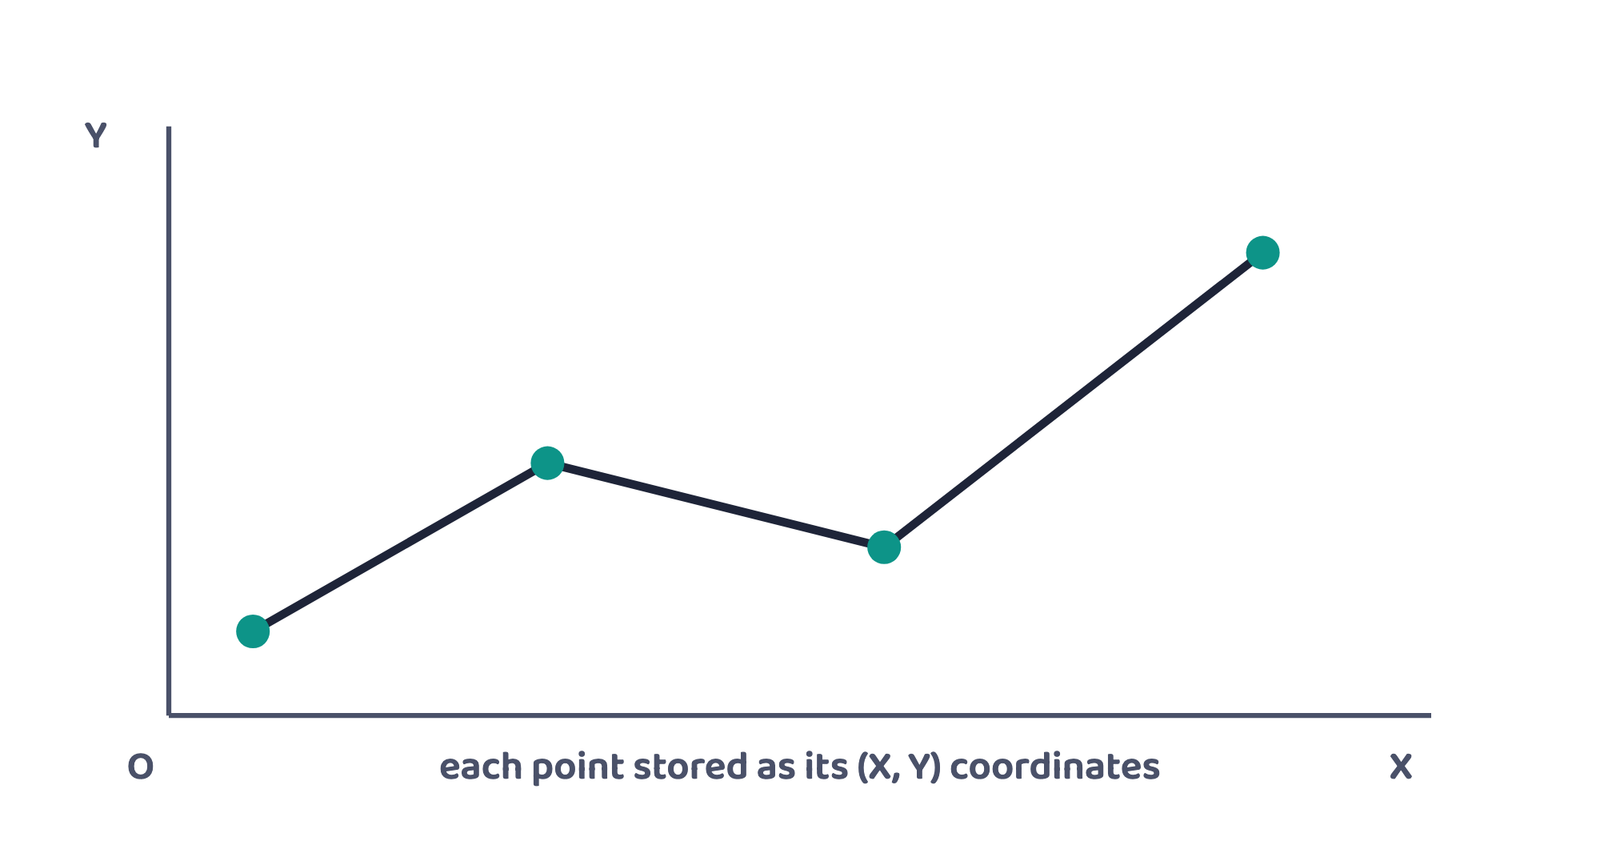
Manual digitising is the best way of putting vector data in. Vector is best used for highly precise applications; when file size matters; when individual map features need analysis; and when descriptive information must be stored.
| Raster model | Vector model | |
|---|---|---|
| Advantages | Simple data structure · easy, efficient overlaying · compatible with satellite imagery · represents high spatial variability efficiently · simple to program · same grid cells serve several attributes | Compact data structure · efficient for network analysis · efficient projection transformation · accurate map output |
| Disadvantages | Inefficient use of computer storage · errors in perimeter and shape · difficult network analysis · inefficient projection transformation · loss of information (less accurate maps) with large cells | Complex data structure · difficult overlay operations · high spatial variability is inefficiently represented · not compatible with satellite imagery |
7 Sequence of GIS Activities
- 3 · Data verification and editing sits between entry and linkage, checking the captured data for errors before it is used further.
7.1 Spatial data input
The spatial database in a GIS can be built in two ways:
(a) From a data supplier
- Digital data is readily available, from small-scale maps to large-scale plans
- Saves overheads of digitising data yourself
- Must check compatibility: scale, geo-referencing system, collection/sampling method, data quality, classification method, size/shape of mapping units, record length
- Older transfer media: DAT tapes, CD-ROMs, floppy disks
(b) Manual input
- Four stages: entering spatial data, entering attribute data, verifying/editing both, linking them where needed
- Two common methods: Digitisation and Scanning
- Digitisers and scanners greatly cut the time and labour of noting coordinates by hand
Data compatibility problems are worst when combining sources across administrative boundaries (inter-district or inter-province data), because different geo-referencing systems and classification methods are more likely to clash there.
7.2 Scanners
Scanners convert analogue data into digital grid-based (raster) images, which may be used directly or further processed into vector topology. There are two basic types: scanners that record data step-by-step, and those that scan a whole document in one operation. Step-type scanners use a light source on a movable arm and a digital camera fitted with Charged Coupled Devices (CCDs), semiconductor sensors that convert light photons into electron counts recorded as a digital value. Maps can be mounted on a flat bed or a rotating drum. A scanned image is never perfect, it carries every smudge and defect of the original, so the excess data must be cleaned before the image is usable.
7.3 Entering the attribute data
Attribute data describes the non-spatial properties of a feature. For example, a road may be captured spatially as a line, while its width, surface type, estimated traffic and traffic regulations are stored as attribute data, either with the spatial object (object-oriented database) or separately and linked to it (relational database). This data can come from published records, official censuses, primary surveys or spreadsheets, entered manually or imported in a standard transfer format.
8 Data Verification, Editing and Conversion
Captured spatial data must be checked for errors before it can be trusted. The classic check is to print the digitised data on a translucent sheet at the same scale as the original, place both on a light table, and compare them visually, working systematically across the map.
| Error type | How it happens |
|---|---|
| Incomplete or double data | Points/lines/polygons omitted during manual entry; in scanned data, gaps where raster-to-vector conversion failed to join a line |
| Wrong scale | Digitising done at the wrong scale, or incorrect values used while geo-referencing scanned data |
| Distorted data | Base maps not scale-correct; aerial photos distorted by lens/relief/tilt; paper maps warped by rain, sunshine or repeated folding |
Corrections are made through software: moving, rotating, erasing, inserting, stretching or truncating features with the keyboard or a screen cursor, and removing excess coordinates on a line using “weeding” algorithms. Faulty raster cells are corrected by changing their value.
When several data layers must be used together, they should all be in the same format. Conversion usually runs vector → raster (most analysis is done in the raster domain), by overlaying a grid of a user-defined cell size. The reverse, raster → vector, is done mainly for data reduction, since raster storage needs are much larger than vector.
9 Geographic Data: Linkages and Matching
Linking spatial and attribute data correctly matters a great deal, careless linking leads to chaos in the final analysis. For example, to find the malnutrition-related mortality rate for children under 10 in a state, one file with the child population and another with malnutrition deaths must first be combined, then one figure divided by the other.
Exact matching combines records from two files using a common key present in both, such as the name of a town, so records about the same feature are joined and stored together.
Hierarchical matching is used when smaller-area data (collected more often, in detail) must match larger administrative units (collected less often). The smaller areas’ data is added up until it matches the bigger unit, then matched exactly.
Fuzzy matching is needed when the boundaries of two data sets don’t align, for example, crop field boundaries rarely match soil-type boundaries. The two layers are overlaid to compute something like crop productivity for each soil type.
10 Spatial Analysis
Analytical power is what makes a GIS different from any other information system. Spatial analysis functions use the spatial and non-spatial attributes stored in the database to answer real questions about the world, developing and applying models that reveal underlying trends. Before any analysis, the problem must be identified and the purpose of the analysis clearly defined. Four spatial analysis operations are possible in a GIS:
This chapter discusses only the first two, overlay and buffer analysis, in detail.
10.1 Overlay analysis
Overlay is the hallmark of GIS: integrating multiple map layers of the same area produces a new map layer. It is similar to sieve mapping, tracing maps on a light table to compare them and produce an output map.
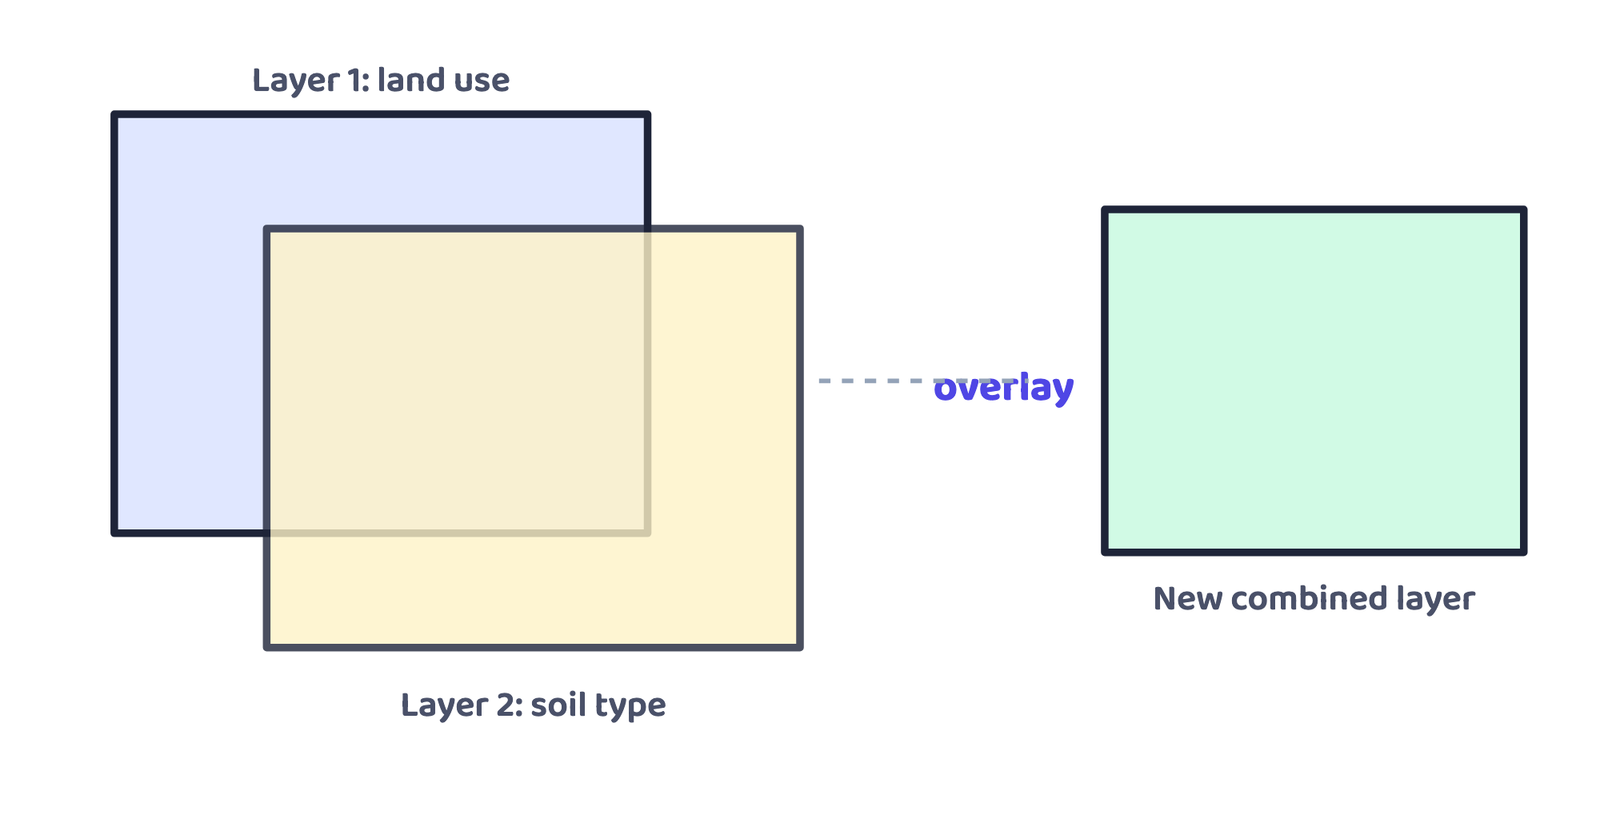
Overlay analysis has many uses. It can compare land use or land cover between two time periods to study change, and it is used in suitability analysis, checking whether a given piece of land is fit for a proposed use. NCERT’s own example: the urban land use of Aligarh city was mapped for 1974 and 2001; overlaying the two maps showed the exact changes in land use and let the urban sprawl over that period be mapped.
10.2 Buffer analysis
A buffer is a zone of a specified distance created around any point, line or area feature. Buffer analysis, also called proximity analysis, is used to find the areas or population that are served, or denied, a facility such as a hospital, medical store, post office, road or park; it can also study the impact of a point source of pollution on health. A buffer operation always generates polygon feature types, whatever the shape of the original feature.
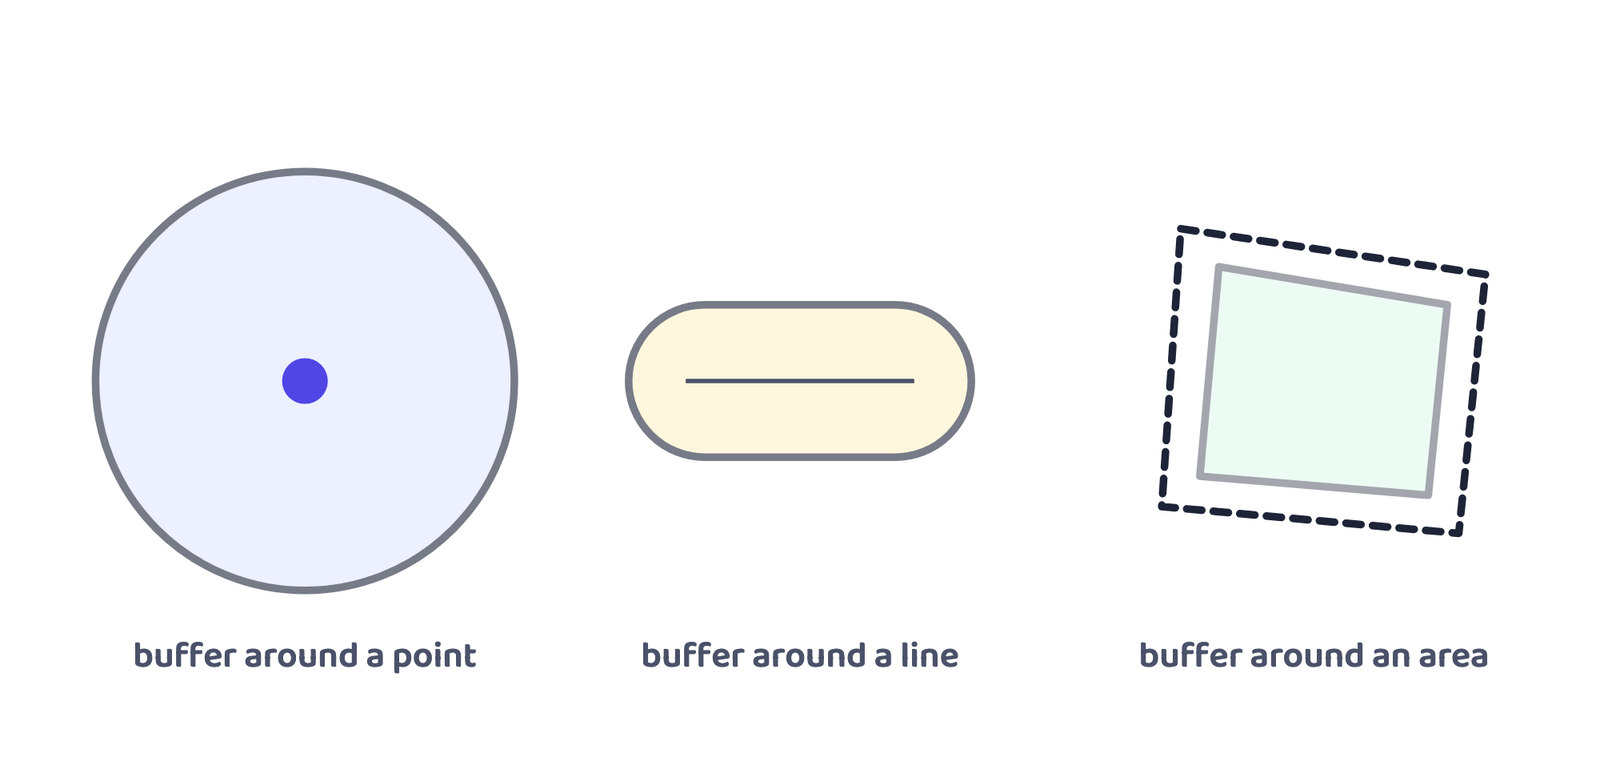
Using GIS software such as ArcView/ArcGIS, Geomedia or Quantum GIS (free open-source software), buffers of 2, 4, 6, 8 and 10 km can be drawn around cities that have a major hospital. As a case study, buffers were created around Saharanpur, Muzaffarnagar, Meerut, Ghaziabad, Gautam Budh Nagar and Aligarh (western Uttar Pradesh). Areas closer to these cities are better served; people living farther away must travel long distances to reach medical services, and those areas are least benefitted.
The chapter points students to three sources: schoolgis.nic.in, bhuvan.nrsc.gov.in and www.iirs.gov.in.
- Spatial Information Technology = RS + GPS + GIS + Digital Cartography + DBMS
- GIS = capturing, storing, checking, integrating, manipulating, analysing and displaying Earth-referenced data; available since the mid-1970s
- Spatial data has a location; non-spatial (attribute) data describes it
- Spatial data appears as point (positional), line (linear) or area (areal) forms
- 5 components of GIS: Hardware, Software, Data, People, Procedures
- Raster = grid of cells with values; Vector = coordinates of points/lines, best for precision and topology
- 5 GIS activities in order: data input → attribute entry → verification/editing → linkage → spatial analysis
- Data input: from a supplier, or manual (digitisation, scanning)
- 3 kinds of matching: Exact (common key), Hierarchical (small areas add up to big units), Fuzzy (overlay mismatched boundaries)
- 4 spatial analysis operations: Overlay, Buffer, Network analysis, Digital Terrain Model; only Overlay and Buffer covered here
- Overlay combines layers into a new map (example: Aligarh land use 1974 vs 2001); Buffer = proximity analysis around a facility
- Can I state the book’s own definitions of GIS and Spatial Information Technology, word for word?
- Can I list the 5 components of GIS and the 3 ways of building a GIS database?
- Can I explain the difference between raster and vector, with one advantage and one disadvantage of each?
- Can I name and explain the three kinds of matching, each with its own example?
- Can I explain overlay analysis and buffer analysis, each with the chapter’s own example?
- 1 markThe spatial data are characterised by the following forms of appearance:
(a) Positional(b) Linear(c) Areal(d) All the above forms - 1 markWhich one of the following operations requires analysis module software?
(a) Data storage(b) Data display(c) Data output(d) Buffering - 1 markWhich one of the following is a disadvantage of the Raster data format?
(a) Simple data structure(b) Easy and efficient overlaying(c) Compatible with remote sensing imagery(d) Difficult network analysis - 1 markWhich one of the following is an advantage of the Vector data format?
(a) Complex data structure(b) Difficult overlay operations(c) Lack of compatibility with remote sensing data(d) Compact data structure - 1 markUrban change detection is effectively undertaken in a GIS core using:
(a) Overlay operations(b) Proximity analysis(c) Network analysis(d) Buffering - 1 markGIS is an amalgamation of Computer Assisted Cartography and:
(a) Remote Sensing only(b) A Database Management System(c) A Global Positioning System(d) A paper topographic map - 1 markThe Charged Coupled Devices (CCDs) used in a scanner are:
(a) Semi-conductor devices that convert light into electron counts(b) Devices that only print maps(c) A type of vector data format(d) A type of buffer analysis - 1 markMatching a town’s records across two files using the town’s name as a common key is an example of:
(a) Fuzzy matching(b) Hierarchical matching(c) Exact matching(d) Buffer matching - 1 markAdvanced computing systems capable of GIS-related work have been available since:
(a) The 1930s(b) The mid-1970s(c) The 1990s only(d) 2010 onward - 1 markWhich of these is NOT one of the five components of GIS?
(a) Hardware(b) People(c) Currency(d) Procedures
Reason (R): Crop field boundaries, for example, are usually defined by field edges and rarely match the boundaries of soil types.
Reason (R): Raster data is always more compact and efficient for network analysis than vector data.
Reason (R): Any change to the information shown on a printed map requires a completely new map to be drawn.
- 2 marksWhat is Spatial Information Technology?
- 2 marksDifferentiate between raster and vector data models.
- 2 marksWhat is an overlay analysis?
- 3 marksWhat are the advantages of GIS over manual methods of handling maps?
- 3 marksWhat are the important components of GIS? Name and briefly explain each.
- 2 marksWhat are the different ways in which spatial data can be built into a GIS core?
- 2 marksDistinguish between spatial data and non-spatial (attribute) data with one example each.
- 3 marksExplain the three types of errors that can occur while capturing spatial data.
- 2 marksWhat is a buffer, and why is buffer analysis also called proximity analysis?
- 3 marksDifferentiate between exact matching, hierarchical matching and fuzzy matching, giving one example of each.
- 2 marksWhy does data conversion usually happen from vector to raster rather than the other way?
- 2 marksState the four spatial analysis operations named in this chapter.
- 5 marksDiscuss the raster and vector data formats, giving one real example of when each would be preferred.
- 5 marksWrite an explanatory account of the sequence of activities involved in GIS-related work, from spatial data input to spatial analysis.
- 5 marksExplain buffer analysis with the help of the chapter’s own case study of hospital buffers around the cities of western Uttar Pradesh.
- 5 marksExplain overlay analysis. How was it used to study urban land use change in Aligarh city between 1974 and 2001?