- What makes an event random, and how probability measures likelihood on a scale of 0 to 1
- The difference between experimental and theoretical probability, and how to calculate each
- How to write the sample space of an experiment and identify an event within it
- How to use a tree diagram to find the probability of outcomes in a multi-step experiment
1Randomness and the Probability Scale
A random experiment is a repeatable action (tossing a coin, rolling a die) where every possible result is known in advance, but which result occurs on any single try cannot be predicted.
Probability measures how likely an event is, on a scale from 0 (impossible) to 1 (certain). Every event’s probability satisfies .
| Event | Where it sits on the scale |
|---|---|
| Getting a number greater than 6 on a standard die | Impossible (0) |
| Rolling a 3 on a standard die | Less likely |
| Flipping a coin and getting heads | Even chance (0.5) |
| Drawing a red sweet from a bag of all red sweets | Certain (1) |
Snakes and Ladders evolved from an ancient Indian dice game, Jñān-Chaupaḍ, where each ladder stood for a virtue and each snake for a vice, teaching moral lessons through the randomness of the dice.
2Two Ways to Measure Probability
Given
A die is rolled 50 times; it lands on 4 exactly 8 times
Find
Experimental probability of rolling a 4
Given
A letter is picked at random from the word “PROBABILITY”
Find
Probability of picking the letter B
PROBABILITY has 11 letters, of which 2 are B. or
Experimental probability can differ from theoretical probability, especially with few trials. As the number of trials grows, experimental probability gets closer and closer to theoretical probability.
If a fair coin lands heads six times in a row, many people believe tails is “due” next. This is false: each toss is independent. The probability of tails on the next toss is still exactly , no matter what happened before. The coin has no memory.
3Sample Spaces and Events
The sample space is the list of every possible outcome of a random experiment, each listed exactly once. The number of outcomes is the sample size, . An event is any subset of the sample space, i.e. any one or more of the possible outcomes we’re interested in.
| Experiment | Sample space | |
|---|---|---|
| Tossing one coin | {H, T} | 2 |
| Rolling one die | {1, 2, 3, 4, 5, 6} | 6 |
| Tossing two coins | {HH, HT, TH, TT} | 4 |
Q. For rolling one die, write the event “the number rolled is greater than 4”.
. The event is
Make sure the sample space matches the detail the question needs. “Will it rain?” might need only {Rain, No Rain}, but a question about rainfall amount needs {No Rain, Drizzle, Light Rain, Heavy Rain} instead.
4Tree Diagrams
A tree diagram maps out every outcome of a multi-step experiment (several independent trials one after another), branch by branch.
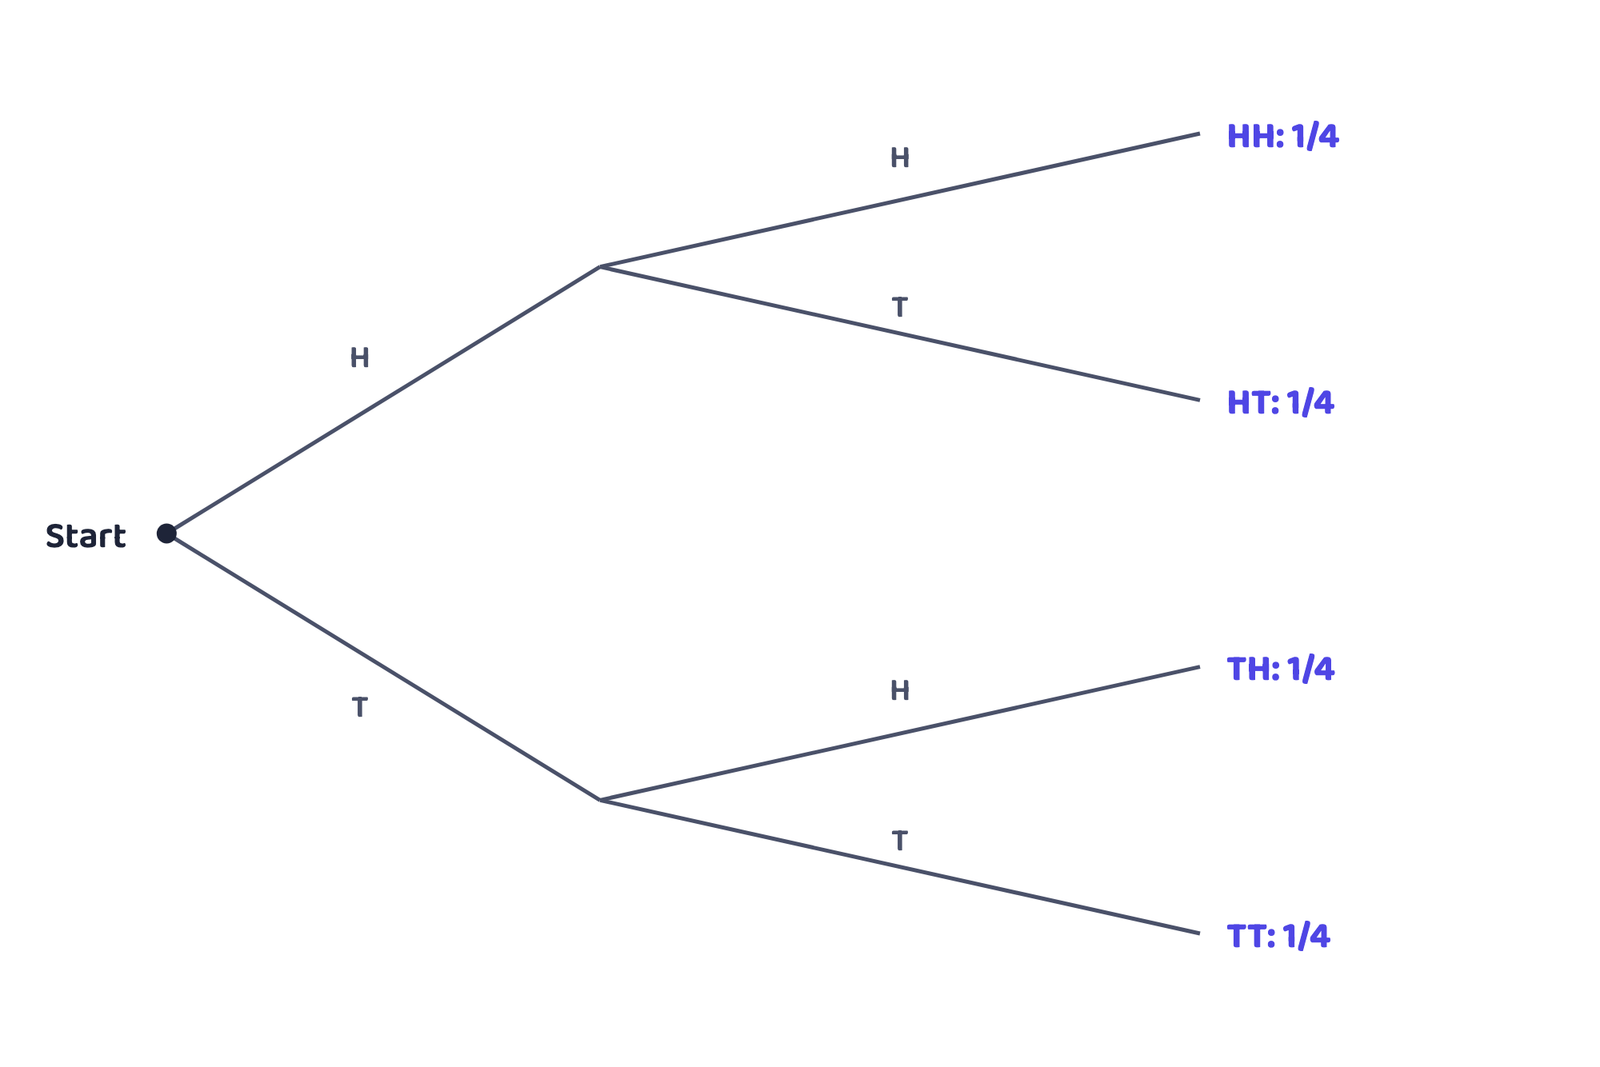
Q. Using the tree diagram, find the probability of getting exactly one head and one tail in two tosses.
Outcomes with exactly one H and one T: HT and TH, so 2 out of 4 outcomes.
or
Probability never tells you what will happen next; it tells you what will happen on average, over many, many tries.
the single idea to carry out of this chapter
- Can I place an event correctly on the 0-to-1 probability scale?
- Can I calculate both experimental and theoretical probability, and explain the difference?
- Can I write out the sample space of an experiment and identify an event within it?
- Can I draw a tree diagram for a two-step experiment and use it to find a probability?
- ; 0 = impossible, 1 = certain
- Experimental probability ; theoretical
- Law of Large Numbers: more trials brings experimental probability closer to theoretical
- Gambler’s Fallacy: independent trials never “remember” past results
- Sample space = every outcome, listed once; event = a subset of
- Tree diagrams list every outcome of a multi-step experiment, branch by branch
- 1 markWhat is the probability of an event that is certain to happen?
- 2 marksIn a survey of 60 students, 18 said cricket was their favourite sport. Find the relative frequency of students who like cricket.
- 2 marksA bag has 5 red, 3 blue and 2 green balls. One ball is picked at random. Find the probability it is not red.
- 2 marksTwo coins are tossed together. What is the probability of getting at least one head?
- 2 marksWrite the sample space for rolling a die and tossing a coin together, and find .
- 2 marksThe letters of the word “STATISTICS” are placed on cards, and one is drawn at random. Find the probability it is a “T”.
- 3 marksA spinner has 8 equally likely numbers, 1 to 8. Find the probability of it landing on: (i) a multiple of 3, (ii) an odd number.
- 3 marksDraw a tree diagram for tossing a coin and then rolling a die. List the sample space and find .
- 2 marksA die is rolled 40 times, landing on 6 exactly 5 times. Find the experimental probability of rolling a 6.
- 3 marksExplain, with an example, why the Gambler’s Fallacy is a mistaken way of reasoning about probability.
- 1 markThe probability of an impossible event is:
(a) 1(b) 0.5(c) 0(d) undefined - 1 markTheoretical probability assumes:
(a) many trials have been performed(b) all outcomes are equally likely(c) the event is impossible(d) nothing about the outcomes - 1 markFor tossing 3 coins, the sample size is:
(a) 3(b) 6(c) 8(d) 9
Reason (R): Each coin toss is an independent event, and the coin has no memory of previous tosses.
- 1 markWhat is the probability a randomly chosen tyre lasts less than 4000 km?
- 1 markWhat is the probability it lasts more than 14000 km?
- 2 marksWhat is the probability it lasts between 4000 and 14000 km (inclusive of both groups)?