- Why India’s population is spread so unevenly, and which factors decide where people settle
- The difference between density, physiological density and agricultural density
- The four historical phases of India’s population growth, and the reason behind each one
- Why some states grow faster than others, and what is happening to India’s adolescent population
- How India’s population is composed by residence, language, religion and occupation
1 Distribution of Population
1.1 Sources of population data
Every fact in this chapter, how many people live where, how fast they are growing, what work they do, comes from one exercise: the Census. It is held every 10 years across the country. India’s first population Census was conducted in 1872, but that count was incomplete; the first genuinely complete Census was held in 1881.
The Census is the official, complete count of a country’s population, carried out by the Government of India once every 10 years.
1.2 Where India’s population is concentrated
India’s 1,210 million people (2011) are not spread evenly across the country. A few states hold most of the population while several large states hold very few people. Uttar Pradesh has the highest population, followed by Maharashtra, Bihar and West Bengal.
Large geographical area does not mean large population. Jammu & Kashmir (1.04% of India’s population), Arunachal Pradesh (0.11%) and Uttarakhand (0.84%) all have big areas but a tiny share of people.
1.3 Physical factors behind distribution
Climate, terrain and the availability of water together decide most of the pattern. The North Indian Plains, river deltas and coastal plains carry a much larger share of population than the interior districts of southern and central India, the Himalayas, and some north-eastern and western states.
1.4 Socio-economic and historical factors
Where farming took root early, where transport networks grew, and where industry and cities developed: that is where population concentrated, even where the land itself was not especially rich.
Irrigation
Rajasthan gained population where canal irrigation reached otherwise dry land.
Minerals & energy
Jharkhand’s mineral and energy resources drew settlement and industry.
Transport network
Peninsular states saw moderate-to-high concentration as transport reached them.
Industry & cities
Delhi, Mumbai, Kolkata, Bengaluru, Pune, Ahmedabad, Chennai and Jaipur pull large numbers of rural-urban migrants.
River plains and coastal regions have stayed densely populated even where farming has degraded the land and water, because they were settled early and their transport links are old and well developed.
2 Density of Population
Density of population is the number of persons living per unit area. It gives a clearer picture of how crowded the land actually is than raw population totals do.
India’s density (2011) is 382 persons per sq km, up from just 117 persons per sq km in 1951: an increase of more than 200 persons per sq km in fifty years.
2.1 A sharper picture: physiological and agricultural density
Ordinary density treats all land as equal, which is misleading in a country where a huge share of people depend on farming. Two better measures correct for this:
2.2 The regional pattern of density
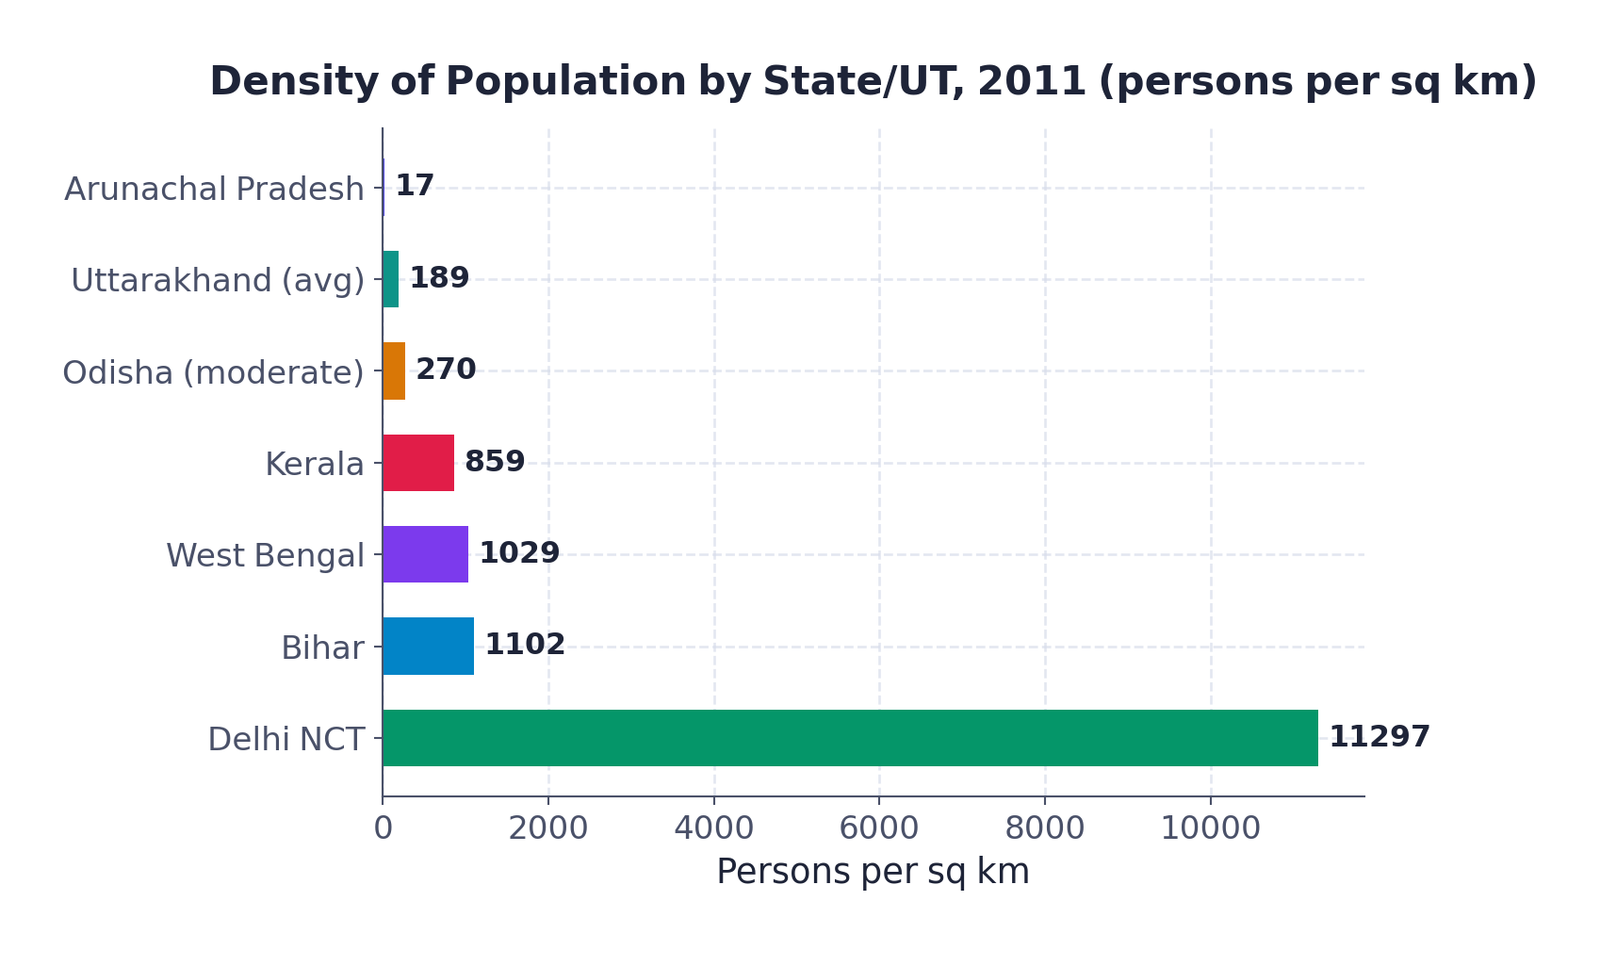
| Region | Density pattern (2011) |
|---|---|
| Northern states | High: Bihar (1,102), West Bengal (1,029), Uttar Pradesh (828) |
| Peninsular states | High: Kerala (859), Tamil Nadu (555) |
| Assam, Gujarat, Andhra Pradesh, Haryana, Jharkhand, Odisha | Moderate density |
| Himalayan hill states and North-East (excluding Assam) | Low density |
| Union Territories (excluding Andaman & Nicobar Islands) | Very high density |
3 Growth of Population
Growth of population is the change in the number of people living in a particular area between two points of time, expressed as a percentage.
Population growth has two components: natural growth (from birth and death rates) and induced growth (from migration in and out of an area). This chapter looks only at natural growth. India’s annual growth rate is 1.64% (2011).
Doubling time = how long at today’s rate to become double
Population doubling time is the time a population takes to double itself at its current annual growth rate.
3.1 A century of decadal growth
| Census year | Total population | Growth (%) |
|---|---|---|
| 1901 | 23,83,96,327 | – |
| 1911 | 25,20,93,390 | (+) 5.75 |
| 1921 | 25,13,21,213 | (−) 0.31 |
| 1931 | 27,89,77,238 | (+) 11.60 |
| 1941 | 31,86,60,580 | (+) 14.22 |
| 1951 | 36,10,88,090 | (+) 13.31 |
| 1961 | 43,92,34,771 | (+) 21.51 |
| 1971 | 54,81,59,652 | (+) 24.80 |
| 1981 | 68,33,29,097 | (+) 24.66 |
| 1991 | 84,63,02,688 | (+) 23.85 |
| 2001 | 1,02,86,10,328 | (+) 21.54 |
| 2011 | 1,21,01,93,422 | (+) 17.64 |
3.2 Four phases of India’s population growth
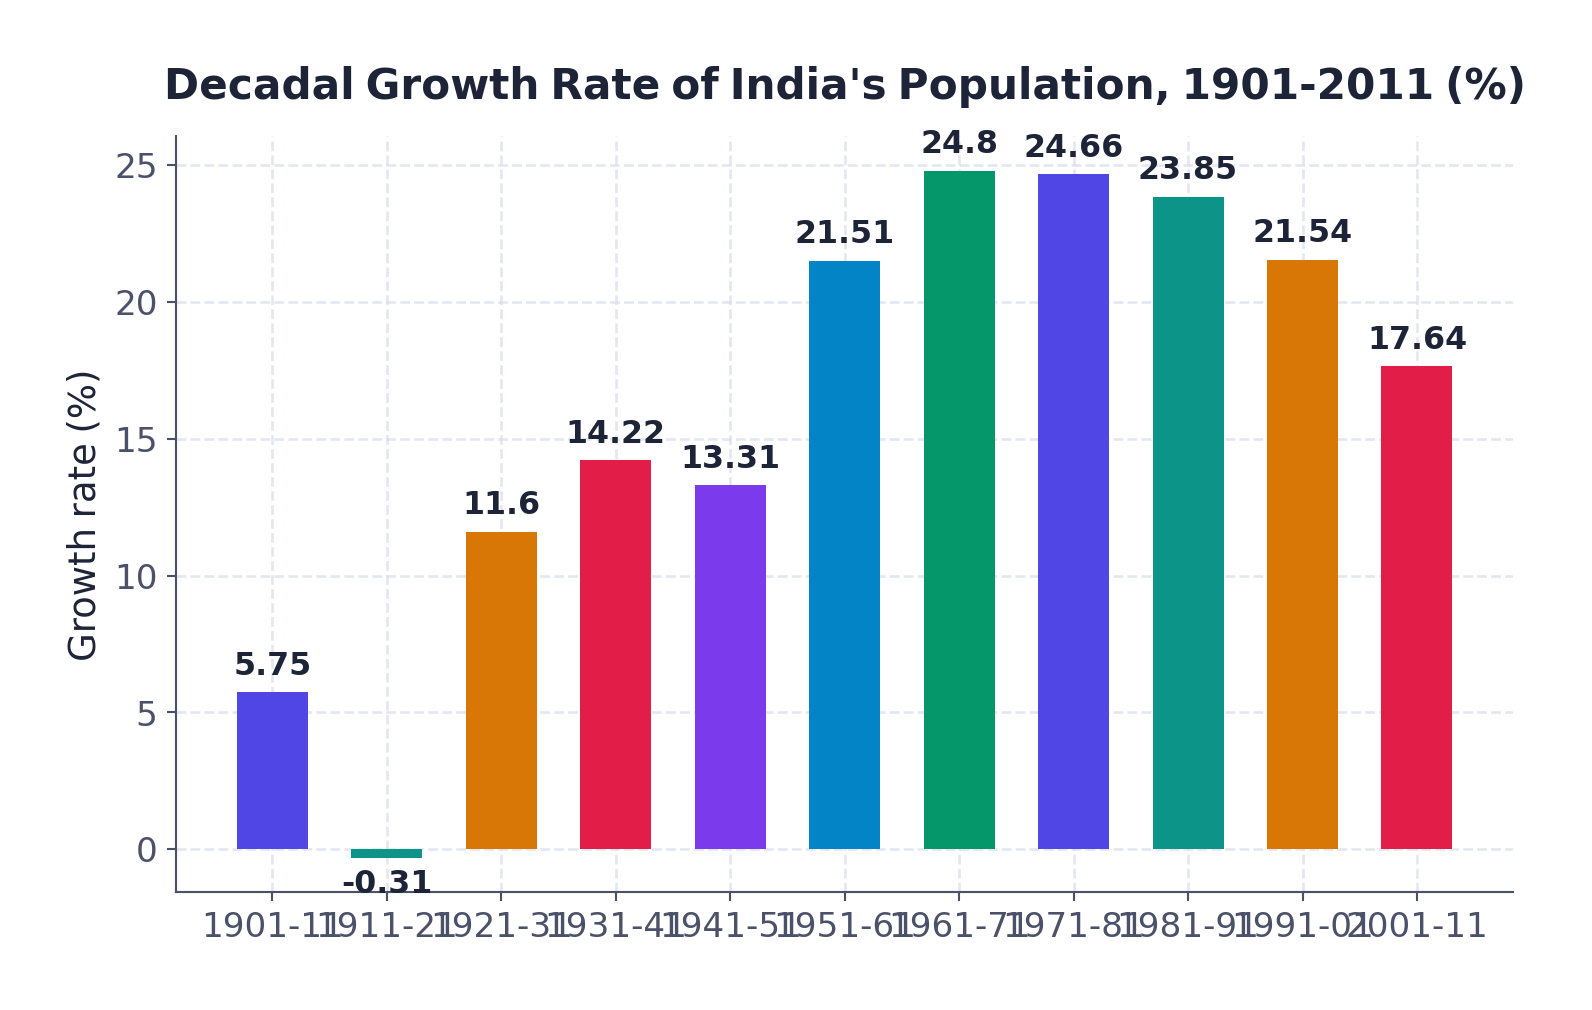
The World Development Report has projected that India’s population will touch 1,350 million by 2025.
4 Regional Variation and the Adolescent Population
The average growth rate hides wide differences between states.
4.1 Low-growth states and the high-growth belt
Low growth (under 20% a decade)
- Kerala, Karnataka, Tamil Nadu, Andhra Pradesh, Odisha, Puducherry, Goa
- Kerala’s 9.4% is the lowest in the entire country
High-growth belt (20-25% a decade)
- A continuous west-to-east belt across the north-west, north and north-central states
- Gujarat, Maharashtra, Rajasthan, Punjab, Haryana, Uttar Pradesh, Uttarakhand, Madhya Pradesh, Sikkim, Assam, West Bengal, Bihar, Chhattisgarh, Jharkhand
Comparing 2001-2011 with 1991-2001, growth rates fell in almost every state. The fall was smallest in Andhra Pradesh (3.5 percentage points) and largest in Maharashtra (6.7 percentage points). Tamil Nadu (+3.9 points) and Puducherry (+7.1 points) were the exceptions: their growth rates actually rose.
4.2 The adolescent population and youth policy
Adolescents (age 10-19 years) make up 20.9% of India’s population (2011): 52.7% male and 47.3% female. This group has high potential but is also vulnerable without proper guidance.
Two government policies respond to this:
- National Youth Policy (NYP-2014), launched February 2014, and aims to empower India’s youth “to find its rightful place in the community of nations”; defines youth as persons aged 15-29 years.
- National Policy for Skill Development and Entrepreneurship (2015): an umbrella framework linking skilling activities to common standards and demand centres.
5 Population Composition: Rural-Urban and Language
Population composition studies how people are distributed by residence, language, religion, and occupation. It is a distinct field within population geography.
5.1 Rural-Urban composition
Rural population is not spread evenly: Himachal Pradesh and Bihar have a very high rural share, while Goa and Mizoram have only just over half their people in villages. Among Union Territories, only Dadra & Nagar Haveli (53.38%) has a notably high rural share; the rest are mostly urban. Village size itself varies hugely: under 200 persons in the north-eastern hill states, western Rajasthan and the Rann of Kuchchh, but up to 17,000 persons in parts of Kerala and Maharashtra.
Urban growth is fastest along road and rail links in the North Indian Plains, and in industrial belts: Kolkata, Mumbai, Bengaluru-Mysuru, Madurai-Coimbatore, Ahmedabad-Surat, Delhi-Kanpur and Ludhiana-Jalandhar. Urbanisation stays low in the agriculturally stagnant middle and lower Ganga plains, Telangana, non-irrigated western Rajasthan, the remote hilly tribal north-east, flood-prone Peninsular areas, and eastern Madhya Pradesh.
5.2 Linguistic composition
According to Grierson’s Linguistic Survey of India (1903-1928), India had 179 languages and 544 dialects. Modern India recognises about 22 scheduled languages plus many non-scheduled ones. Hindi has the largest number of speakers among scheduled languages; Sanskrit, Bodo and Manipuri have the smallest speaker groups (2011). Linguistic regions have no sharp boundary; they gradually merge at their frontier zones.
Indo-European (Aryan) is by far India’s largest language family at 73%, a favourite one-mark question. Dravidian is second at 20%.
6 Religious Composition and the Working Population
6.1 Religious composition
| Religious group | % of total (2011) | Where mostly concentrated |
|---|---|---|
| Hindus | 79.8 | Majority in most states (70-90%+), except border districts and the North-East hill states |
| Muslims | 14.2 | J&K, districts of WB & Kerala, many UP districts, Delhi region, Lakshadweep; majority in Kashmir valley and Lakshadweep |
| Christians | 2.3 | Western coast (Goa, Kerala), hill states of Meghalaya, Mizoram, Nagaland, Chotanagpur, Manipur hills |
| Sikhs | 1.7 | Punjab, Haryana, Delhi |
| Buddhists | 0.7 | Mostly Maharashtra; also Sikkim, Arunachal Pradesh, Ladakh (J&K), Tripura, Lahul & Spiti (HP) |
| Jains | 0.4 | Urban Rajasthan, Gujarat, Maharashtra |
| Other religions & persuasions | 0.7 | Small scattered pockets across the country |
| Religion not stated | 0.2 | – |
Religion shapes the landscape too: sacred structures range from small village shrines to grand temples, masjids, gurudwaras, monasteries and cathedrals, each differing in size and use across the country.
6.2 Composition of the working population
By economic status, India’s population splits into three groups: main workers, marginal workers and non-workers.
A main worker works for at least 183 days (6 months) in a year; a marginal worker works for fewer than 183 days in a year. (Standard Census definition.)
Workers (main + marginal) make up only 39.8% of the population (2011), leaving about 60% as non-workers, pointing to a large dependent population and the possibility of widespread under-employment.
The Work Participation Rate (WPR) is the proportion of a population that is economically active (working). In India it ranges from 29.1% (Lakshadweep) to 51.9% (Himachal Pradesh).
WPR tends to be higher where economic development is lower, because more manual workers are needed for subsistence-level activity. States with high WPR include Himachal Pradesh, Sikkim, Chhattisgarh, Andhra Pradesh, Karnataka, Arunachal Pradesh, Nagaland, Manipur and Meghalaya; among Union Territories, Dadra & Nagar Haveli and Daman & Diu stand out.
Occupational categories and sectoral shift
The 2011 Census divides India’s working population into four occupational categories:
Cultivators
Agricultural Labourers
Household Industrial Workers
Other Workers
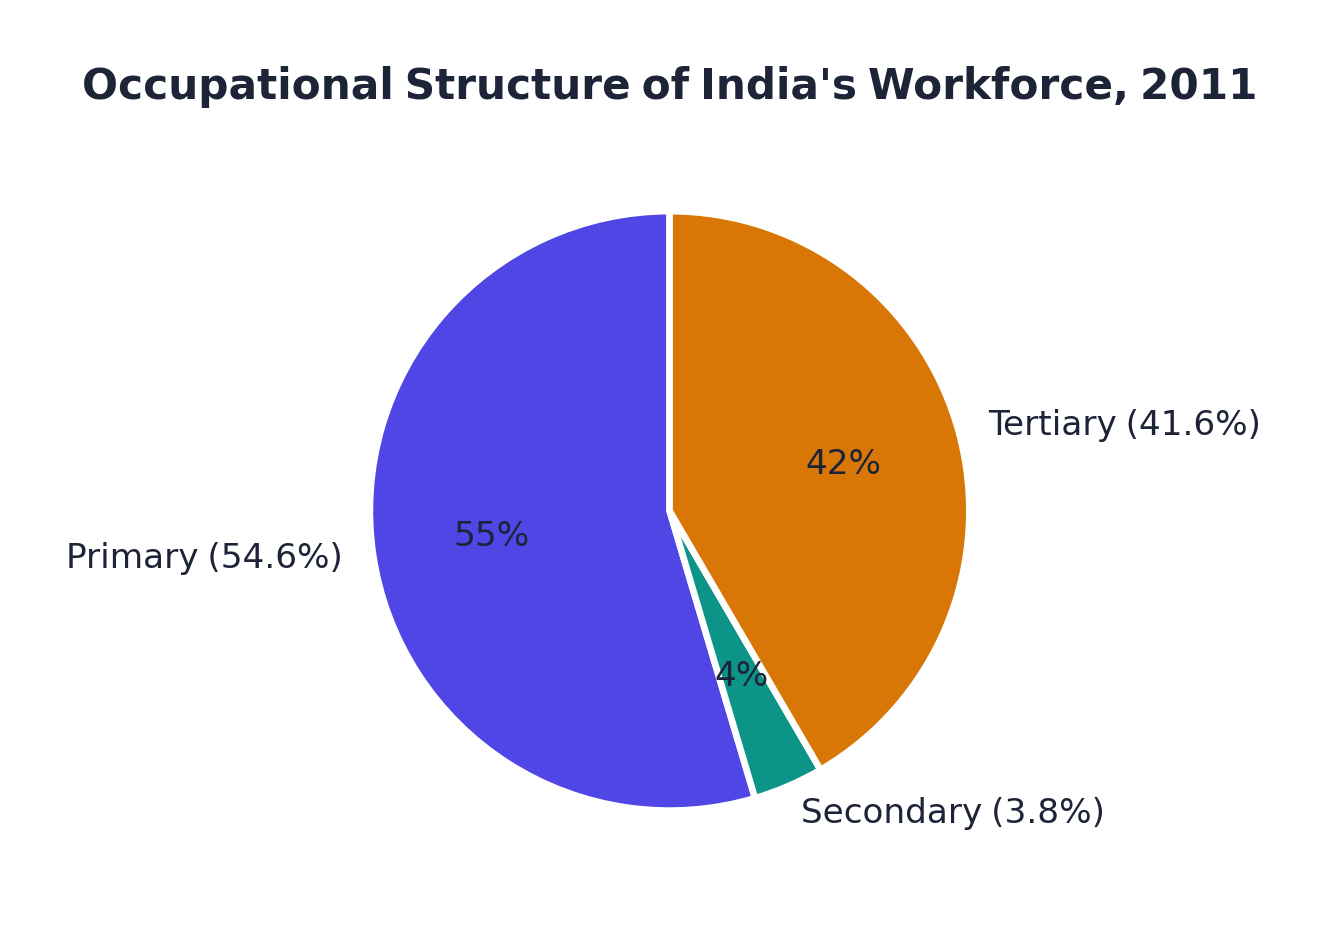
Cultivators and agricultural labourers together are about 54.6% of all workers; only 3.8% work in household industries; the remaining 41.6% are “other workers” (non-household industry, trade, commerce, construction, other services). The agricultural sector’s share has been falling, from 58.2% in 2001 to 54.6% in 2011, as dependence shifts from farm to non-farm occupations, a sign of a wider sectoral shift in the economy.
Male workers outnumber female workers in all three sectors, though female participation is relatively high in the primary sector and has been improving in secondary and tertiary sectors in recent years.
More cultivators
- Himachal Pradesh and Nagaland
More agricultural labourers
- Bihar, Andhra Pradesh, Chhattisgarh, Odisha, Jharkhand, West Bengal, Madhya Pradesh
Highly urbanised areas (Delhi, Chandigarh, Puducherry) have a very large share of workers in “other services”, reflecting both limited farmland and large-scale urbanisation and industrialisation.
Society treats the divide between male, female and transgender as purely natural, but roles assigned to people are actually social constructs, reinforced by institutions, and these become a basis for discrimination. The UNDP’s 1995 Human Development Report put it plainly: “If development is not engendered, it is endangered.” The Government of India’s ‘Beti Bachao – Beti Padhao’ campaign is a direct response to this, promoting gender sensitivity nationwide.
- Census every 10 years; first Census 1872, first complete Census 1881
- Population unevenly distributed: UP > Maharashtra > Bihar > West Bengal; physical + socio-economic factors decide the pattern
- Density 2011 = 382/sq km (up from 117 in 1951); lowest Arunachal Pradesh (17), highest Delhi (11,297)
- Physiological density and agricultural density give a sharper human-land picture than plain density
- Annual growth rate 1.64% (2011); four phases: stagnant (1901-21), steady (1921-51), explosion (1951-81), slowing (post-1981)
- Kerala has India’s lowest decadal growth rate (9.4%); a 20-25% belt runs across the north-west, north and north-central states
- Adolescents (10-19 yrs) = 20.9% of population; NYP-2014 defines youth as 15-29 years
- 68.8% rural, 31.16% urban (2011); urban growth concentrated along transport links and industrial belts
- 4 language families: Indo-European/Aryan 73%, Dravidian 20%, Austric 1.38%, Sino-Tibetan 0.85%
- Hindus 79.8%, Muslims 14.2%, Christians 2.3%, Sikhs 1.7%, Buddhists 0.7%, Jains 0.4%
- Only 39.8% of population are workers; WPR ranges 29.1% (Lakshadweep) to 51.9% (Himachal Pradesh)
- Primary 54.6%, Secondary 3.8%, Tertiary 41.6% of the workforce; agriculture’s share is falling
- Can I state the four phases of population growth with a reason for each, without looking?
- Can I write the formulas for physiological density, agricultural density and decadal growth rate?
- Can I name at least 4 states each for high and low population growth?
- Can I give the percentage share of all four language families and all major religions?
- 1 markIndia’s population as per the 2011 Census is:
(a) 1,028 million(b) 3,182 million(c) 3,287 million(d) 1,210 million - 1 markWhich of the following states has the highest density of population in India (2011)?
(a) West Bengal(b) Kerala(c) Uttar Pradesh(d) Bihar - 1 markWhich of the following states has the highest proportion of urban population according to the 2011 Census?
(a) Tamil Nadu(b) Maharashtra(c) Kerala(d) Goa - 1 markWhich is the largest linguistic group of India?
(a) Sino-Tibetan(b) Indo-Aryan(c) Austric(d) Dravidian - 1 markWhich decade recorded a negative growth rate in India’s population?
(a) 1901-11(b) 1911-21(c) 1921-31(d) 1931-41 - 1 markA person who works for less than 183 days in a year is called a:
(a) main worker(b) marginal worker(c) non-worker(d) cultivator - 1 markWhich phase of India’s population growth is called the “population explosion” phase?
(a) 1901-1921(b) 1921-1951(c) 1951-1981(d) post-1981 - 1 markThe ‘Beti Bachao – Beti Padhao’ campaign was launched mainly to address:
(a) rural unemployment(b) gender discrimination(c) urban migration(d) linguistic diversity
- 1 mark
Assertion (A): Density of population is a crude measure of the human-land relationship.
Reason (R): Physiological and agricultural densities give a more meaningful picture of population pressure on cultivated land. - 1 mark
Assertion (A): Growth rate of India’s population was negative during 1911-1921.
Reason (R): Poor health and medical services and an inefficient distribution system for food kept both birth and death rates low. - 1 mark
Assertion (A): Kerala has recorded the lowest decadal population growth rate in India.
Reason (R): Kerala registered a growth rate of 9.4% in that decade, the lowest not only among this group of states but in the country as a whole.
- 1 markDefine density of population.
- 1 markWhat is population doubling time?
- 1 markName the two components of population growth.
- 1 markWhich state has the highest share of India’s population?
- 1 markIn which year was India’s first Census conducted?
- 1 markName the smallest religious groups in India by population share.
- 3 marksVery hot-and-dry and very cold-and-wet regions of India have low density of population. Explain the role of climate in the distribution of population in this light.
- 3 marksWhich states of India have a large rural population? Give one reason for such a large rural population.
- 3 marksWhy do some states of India have higher rates of work participation than others?
- 3 marks‘The agricultural sector has the largest share of Indian workers.’ Explain.
- 3 marksDistinguish between a main worker and a marginal worker as per the Census definition.
- 3 marksWhat challenges does India’s adolescent population face? Name any three.
- 5 marksDiscuss the spatial pattern of density of population in India.
- 5 marksGive an account of the occupational structure of India’s population.
- 5 marksDescribe the four phases of India’s population growth, with the reasons behind each.
- 5 marksDiscuss the regional variation in population growth rates across Indian states between 1991 and 2011.