
- Why different people can want completely different, even conflicting, things from “development”
- What per capita income means, how it is calculated, and how the World Bank uses it to classify countries
- Why two places with the same income can still be very differently developed, using Haryana, Kerala and Bihar
- What the Human Development Index adds that income alone cannot show
- Why development also has to be sustainable, with real examples of renewable and non-renewable resources
1What Development Means
The idea of development, or progress, has always been with people. Everyone has
aspirations about how they would like to live, and every country has ideas about
what it should become. Can life be better for everyone? Can there be more
equality? Development involves thinking about these questions and about the
ways in which we can work towards achieving these goals.
Development involves thinking about questions such as: What are the
essential things that we require? Can life be better for all? How should
people live together? Can there be more equality? It also involves thinking
about the ways in which we can work towards achieving these goals. Different
persons can have different developmental goals.
This is not only an economics question. How we live today is shaped by the
past, and hopes for change can only really be achieved through a democratic
political process, which is why development is studied in history and
political science too, not economics alone.
2Different People, Different Goals
Different groups of people want very different things from development, because
their life situations are different. Table 1.1 of the book lists eight kinds of
persons: landless rural labourers; prosperous farmers from Punjab; farmers who
depend only on rain for growing crops; a rural woman from a land owning family;
urban unemployed youth; a boy from a rich urban family; a girl from a rich urban
family; and an adivasi from Narmada valley. The book fills in the goals of three
of them and asks you to complete the rest:
Landless rural labourers
More days of work and better wages; a local school that gives their
children a quality education; no social discrimination, and a chance to
become leaders in their own village.
Prosperous farmers from Punjab
A high, assured family income through better support prices for their
crops and cheap, hardworking labourers; being able to settle their
children abroad.
A girl from a rich urban family
As much freedom as her brother, and the ability to decide for herself
what she wants to do in life, including studying abroad.
Notice that these goals are not the same, and some can actively conflict. A
girl may want as much freedom as her brother, and want him to share the
housework. Her brother may not like this at all. Industrialists may want more
dams built for more electricity, but a dam can submerge land and displace the
people who are displaced, such as tribals; they may prefer small check dams or
tanks to irrigate their land. A photograph in the book shows a demonstration
meeting against raising the height of the Sardar Sarovar Dam on Narmada
River.
The book’s own question (Let’s Work These Out, Q1) asks: “Why do different persons have different
notions of development?” The answer is not “because people are different.” It is because their
life situations are different, which is what causes them to want
different things.
One: different persons can have different developmental goals. Two:
what counts as development for one person may not be development for
another; it can even work against them.
3Income and Other Goals
Almost everyone wants more income, but income is not the only thing people
want. People also want equal treatment, freedom, security, and respect from
others, and they resent being discriminated against. These goals matter so much
that, in some situations, they can matter even more than extra income or
consumption, because material goods are not all a person needs to live well.
Think about choosing a job. Before accepting one far from home, a person
would think about more than just the salary: the facilities available for
their family, the working atmosphere, and the opportunity to learn. A job that
pays less but is secure may be preferred over one that pays more but offers no
job security and leaves no time for family.
Q. Why is it wrong to say that money can measure everything
important about development?
A. Many important things in life cannot easily be measured in
rupees: friendship, a safe and secure environment, respect, freedom, and
the dignity that comes from paid work. They still matter a great deal to
the quality of a person’s life. The book itself warns: “it will be wrong to
conclude that what cannot be measured is not important.”
The same logic connects to women’s status: when women take up paid work,
their dignity in the household and in society rises. At the same time, more
respect for women leads to more sharing of housework and greater acceptance of
women working outside the home. A safe and secure environment may allow more
women to take up a variety of jobs or run a business.
4National Development
Just as individuals want different things, a country’s people can have
different, even conflicting, notions of what national development should
mean. When ideas conflict, some questions become important: is a plan fair and
just for everyone? Would it benefit a large number of people, or only a small
group?
The book uses a real newspaper report as a discussion example: a vessel
once dumped 500 tonnes of liquid toxic waste into open-air dumps in the city
of Abidjan, Ivory Coast (a country in Africa) and in the surrounding sea.
The toxic fumes caused nausea, skin rashes, fainting and diarrhoea; within a
month, seven people were dead, twenty were hospitalised, and twenty-six
thousand were treated for symptoms of poisoning. A multinational petroleum-and-metals
company had contracted a local company to dispose of the waste from its
ship. The book asks: who benefited from this, and who did not?
5How to Compare Different Countries or States?
Just as we might use different criteria to compare students for different
purposes (sports, debate, music), countries can be compared using different
criteria too. For comparing countries, income is treated as one of the
most important attributes: the idea being that more income means more of
what people need.
Per capita income (average income) is the total income of a
country divided by its total population. It is used instead of total
income because countries have different populations, so total income alone
does not tell us what an average person is likely to earn.
In its World Development Reports, the World Bank classifies
countries by per capita income (2024 figures, use these exact numbers, not
older ones):
- High income / rich countries: per capita income of US$66,500 per annum and above
- Low-income countries: per capita income of about US$2,300 or less
- India: per capita income of about US$11,000 in 2024, which places it in the low middle income category
“Rich countries, excluding countries of the Middle East and certain other
small countries, are generally called developed countries”: this exact
qualification is the book’s own and is worth remembering, because a plain
“rich = developed” answer misses it.
5.1 Average income can hide unequal distribution
Averages are useful, but they can hide real differences between people. The
book gives two imagined countries, each with five citizens, whose monthly
incomes (in Rupees) are:
| Country | Citizen I | II | III | IV | V | Average |
|---|---|---|---|---|---|---|
| Country A | ₹9,500 | ₹10,500 | ₹9,800 | ₹10,000 | ₹10,200 | ₹10,000 |
| Country B | ₹500 | ₹500 | ₹500 | ₹500 | ₹48,000 | ₹10,000 |
Country A
- Nobody very rich, nobody very poor
- More equitable distribution
- Most people would prefer to live here
Country B
- Most citizens poor, one person extremely rich
- Same average income as Country A
- Some may prefer it only if assured of being its rich fifth citizen; if a lottery decided citizenship, most would prefer Country A
Do not assume that equal average income means equal development. The
average is identical in both countries above, but the book says Country A is
preferred because it has more equitable distribution: its people are neither
very rich nor extremely poor, while in Country B most citizens are poor and
one person is extremely rich.
6Income and Other Criteria: Comparing States
Table 1.3 in the book gives the per capita income of three Indian states for
2023-24 (technically “Per Capita Net State Domestic Product at Current
Prices”, the book itself says to simply treat this as the state’s per capita
income), from the Economic Survey 2024-25:
By per capita income alone, Haryana looks the most developed of the three
and Bihar the least. But Table 1.4 gives more data on the same three states:
| State | Infant Mortality Rate (per 1,000 live births, 2020) |
Literacy Rate % (2017-18) |
Net Attendance Ratio, secondary stage, 15-17 yrs (2017-18) |
|---|---|---|---|
| Haryana | 28 | 82 | 73 |
| Kerala | 6 | 94 | 94 |
| Bihar | 27 | 62 | 69 |
Even though Haryana has the highest per capita income, its Infant Mortality
Rate (28) is about 4.7 times Kerala’s (6) (28 ÷ 6 ≈ 4.7), and both its literacy rate and
attendance ratio trail Kerala’s. About one-third of children aged 15-17 in
Bihar are not attending school at the secondary stage.
Infant Mortality Rate (IMR) indicates the number of children who
die before the age of one year, as a proportion of 1,000 live children born
in that year.
Literacy Rate measures the proportion of the literate population in
the age group of 7 years and above.
Net Attendance Ratio is the total number of children of the age
group 15-17 years attending school, as a percentage of the total number of
children in that same age group.
7Public Facilities
Why does the average person in Haryana earn more than the average person in
Kerala, yet lag behind in health and education? Because money in your pocket
cannot buy every good and service you need to live well: it cannot, by
itself, buy you a pollution-free environment, guarantee unadulterated
medicines, or protect you from infectious disease unless your whole community
takes preventive steps.
For many of the most important things in life, the cheapest way to provide
them is collectively: shared community security is cheaper than every
household hiring its own guard, and government schools let children study even
where individual families cannot afford a private school. Kerala’s low Infant
Mortality Rate is credited to its adequate provision of basic health and
educational facilities. Similarly, in some states the Public Distribution
System (PDS) functions well, and the health and nutritional status of people
of such states is likely to be better.
Income buys goods. Facilities need everyone.
A pollution-free environment, unadulterated medicines and protection from
infectious disease are things money alone may not buy; the book says many
important things are best, and most cheaply, provided collectively.
7.1 Two classroom activities in the book
Activity 2, Table 1.5 gives the educational achievement of the rural
population of Uttar Pradesh:
| Category | Male | Female |
|---|---|---|
| Literacy rate for rural population | 76% | 54% |
| Literacy rate for rural children aged 10-14 | 90% | 87% |
| Rural children aged 10-14 attending school | 85% | 82% |
So 18% of rural girls and 15% of rural boys aged 10-14 are not attending
school, and illiteracy in this age group is 13% for girls and 10% for boys. The
book calls this “most disturbing”, because the constitutional goal of free and
compulsory education for all children up to the age of 14 was expected to be
achieved by 1960.
Body Mass Index (BMI) is a way to find out whether we are properly
nourished (Activity 3): divide a person’s weight in kilograms by the square of
the height in metres. Compared with the BMI-for-age tables, a student’s BMI
can be normal, below normal (underweight, undernourished) or above normal
(overweight). For example, a 14-year-8-month-old girl with a BMI of 15.2 is
undernourished, and a 15-year-6-month-old boy with a BMI of 28 is
overweight.
8The Human Development Report
Since income alone is an inadequate measure of development, health and
education indicators have come to be used alongside it. The United Nations
Development Programme (UNDP) publishes the Human Development Report,
comparing countries on their people’s education, health, and per capita
income.
The Human Development Index (HDI) ranks countries using a
combination of health, education and per capita income indicators. By
putting “Human” before “Development”, it makes clear that what matters most
is what is happening to a country’s own citizens, their health and their
well-being.
Table 1.6 gives 2023 data for India and its neighbours (source: Human
Development Report 2025, UNDP):
| Country | GNI per capita (2021 PPP $) |
Life Expectancy at birth |
Mean Years of Schooling (25+ yrs) |
HDI Rank (out of 193) |
|---|---|---|---|---|
| Sri Lanka | 12,616 | 77.5 | 10.8 | 89 |
| India | 9,047 | 72 | 6.9 | 130 |
| Myanmar | 4,919 | 66.9 | 6.4 | 150 |
| Pakistan | 5,501 | 67.6 | 4.3 | 168 |
| Nepal | 4,726 | 70.4 | 4.5 | 145 |
| Bangladesh | 8,498 | 74.7 | 6.8 | 130 |
Life Expectancy at birth denotes the average expected length of life
of a person at the time of birth (Table 1.6, Note 2).
Purchasing Power Parity (PPP): the per capita income in Table 1.6 is
calculated in dollars for all countries so that it can be compared, and in a way
that every dollar would buy the same amount of goods and services in any
country (Table 1.6, Note 3). That is what “PPP” in the column heading means.
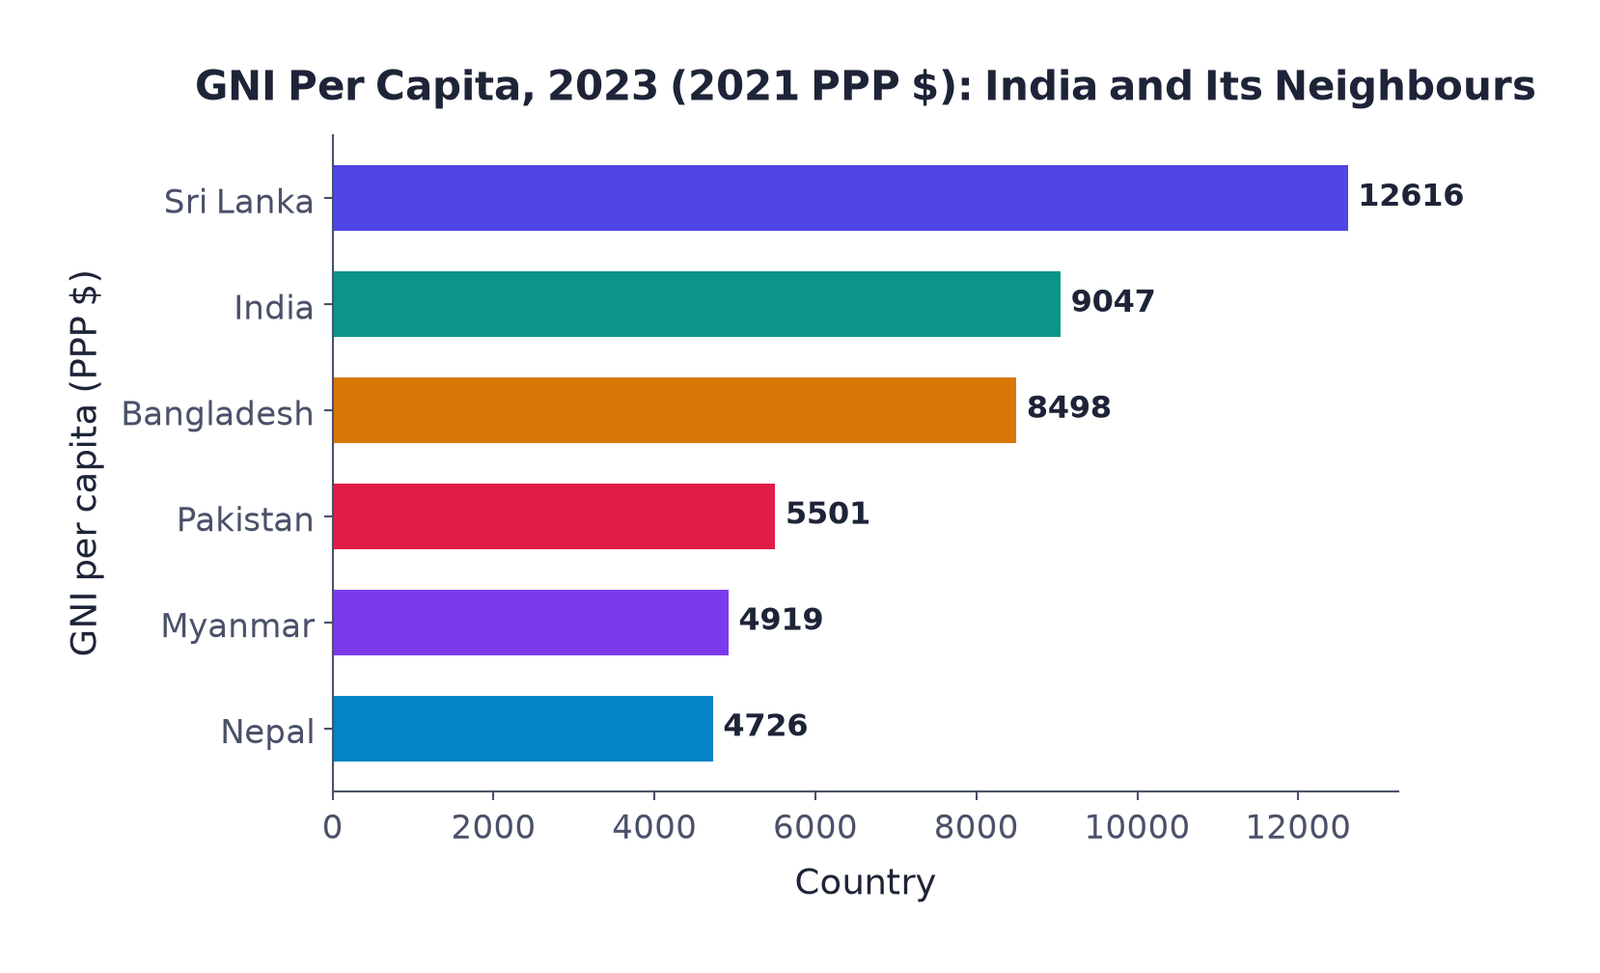
neighbours, 2023 data from the Human Development Report 2025. Sri Lanka
leads the group; Nepal and Bangladesh trail India here on income, which the
next paragraph compares with life expectancy.
A striking finding: Sri Lanka, a much smaller neighbouring country, ranks far
ahead of India on every single column of this table (rank 89 against India’s
130). Table 1.6 also shows that Nepal and Bangladesh have lower per capita
income than India, and Bangladesh still has a higher life expectancy (74.7)
than India (72). This is the kind of finding that shows why looking at income
alone can be misleading.
Do not assume the country with the highest income in a table always has
the best HDI rank. Always check health and schooling separately, not
income alone; a lower-income country can still do better on some of these
measures.
Read the life expectancy column of Table 1.6 carefully. Of India’s two
lower-income neighbours, only Bangladesh (74.7) has a higher life
expectancy than India (72); Nepal’s (70.4) is lower than
India’s.
9Sustainability of Development
A country’s development should not just go up: it should be maintainable
for future generations too. Since the second half of the twentieth century, a
number of scientists have been warning that the present type, and levels, of
development are not sustainable. As the
book puts it: “We have not inherited the world from our forefathers — we
have borrowed it from our children.”
Renewable resources
- Replenished by nature, e.g. crops, plants, groundwater
- Can still be overused if used faster than nature replenishes them
Non-renewable resources
- A fixed stock on Earth that cannot be replenished, e.g. crude oil
- New sources can be discovered, but the stock still runs out eventually
9.1 Example: Groundwater (a renewable resource, overused)
Groundwater is replenished by rainfall, but if it is drawn out faster than
rain replenishes it, it is being overused. The book’s own data: about
300 districts have reported a water-level decline of over 4 metres
during the past 20 years; nearly one-third of the country is already
overusing its groundwater reserves, and in another 25 years 60 per
cent of the country would be doing the same if present use continues.
Overuse is concentrated in the agriculturally prosperous regions of Punjab and
Western U.P., the hard-rock plateau areas of central and south India, some
coastal areas, and fast-growing urban settlements.
9.2 Example: Crude Oil (a non-renewable resource)
Table 1.7 (source: Energy Institute’s Statistical Review of World Energy,
2024) gives 2017 reserve estimates:
| Region / Country | Reserves (2017) (thousand million barrels) |
Number of years reserves will last |
|---|---|---|
| Middle East | 836 | 70 |
| United States of America | 69 | 10.5 |
| World | 1,732 | 47 |
The table above gives the world’s reserves as lasting 47 years,
but the NCERT text just after the table says the reserves “would
last only 50 years more. This is for the world as a whole.” Both
numbers are exactly as printed in the book: if a question asks “how many
years will world crude oil reserves last as per the table,” answer
47 years (that is the table’s own figure); if it asks what the
text says, the answer is “about 50 years.”
Countries like India, which do not have enough oil stocks of their own,
depend on imports, a burden whenever oil prices rise. Countries with low
reserves, such as the USA, may instead try to “secure oil through military or
economic power.” Environmental degradation from resource overuse does not
respect national or state borders, which is why sustainability has become a
shared field for scientists, economists and other social scientists working
together.
Development is a perennial question. At every point in time, as a
society and as individuals, we must keep asking where we want to go, what
we wish to become, and what our goals really are.
the debate on development never really ends
- Can I explain, with an example, why different people have different developmental goals?
- Can I state the World Bank’s 2024 income thresholds for rich and low-income countries, and where India falls?
- Can I explain, using Haryana, Kerala and Bihar, why per capita income alone can be misleading?
- Can I define IMR, Literacy Rate, Net Attendance Ratio and HDI without looking?
- Can I give the chapter’s example of a renewable resource being overused, and of a non-renewable resource being exhausted?
- Development means different things to different people because their life situations differ, and one person’s development can even harm another’s
- Per capita income = total income ÷ population; World Bank 2024: rich ≥ US$66,500, low ≤ US$2,300, India ≈ US$11,000 (low middle income)
- Same average income can hide very unequal distribution (Country A vs Country B)
- Haryana has the highest per capita income of the three states studied, but worse IMR, literacy and attendance than Kerala
- Money alone may not buy a pollution-free environment, unadulterated medicines or protection from infectious disease; many such things are best provided collectively
- HDI (UNDP) combines health, education and income: Sri Lanka ranks far above India despite being a much smaller country
- Development must be sustainable: groundwater (renewable) is being overused; crude oil (non-renewable) is a fixed stock that will run out (world reserves: 47 years in Table 1.7)
- 1 markDefine per capita income.
- 1 markWhat is the World Bank’s cut-off for a “low-income” country in 2024?
- 3 marksWhy do different people have different notions of development? Give one example of conflicting goals.
- 3 marksUsing Table 1.3 and Table 1.4, explain why per capita income alone cannot decide which of Haryana or Kerala is more developed.
- 5 marksWhat does the Human Development Index measure, and why is it considered better than per capita income alone? Use the India-Sri Lanka comparison in your answer.
- 5 marksDistinguish between renewable and non-renewable resources, with the chapter’s example of each (groundwater overuse; exhaustion of crude oil).