
- How to sort every job in the economy into a primary, secondary or tertiary sector, and why the tertiary sector has become India’s largest producing sector (largest share of GVA) while the primary sector still employs the most workers
- How economists measure the size of the whole economy using GDP and GVA, and why only “final” goods get counted
- Why a farmer’s whole family can be “working” all day and still not be fully employed (underemployment) and what the government does about it
- What separates an organised-sector job from an unorganised one, using two example workers, Kanta and Kamal
- Why some things (railways, dams, schools) are run by the government instead of private companies
1Sectors of Economic Activities
Look around you. A farmer is growing wheat, a factory worker is stitching shirts, a teacher is taking a class, a courier is delivering a parcel. All of these are economic activities, but they are clearly not the same kind of work. To make sense of an economy with millions of different jobs, economists group similar activities together. Each such group is called a sector. This chapter looks at three different ways of doing this grouping: by the nature of the activity (primary, secondary, tertiary), by employment conditions (organised, unorganised) and by who owns the enterprise (public, private).
1.1 Primary sector
The primary sector covers activities that produce goods by directly using natural resources. It is called “primary” because it forms the base for everything else we make. Since most of the natural products we get are from agriculture, dairy, fishing and forestry, it is also called the agriculture and related sector.
Growing cotton depends mainly on rainfall, sunshine and climate, not on a factory. Getting milk from a cow depends on the animal’s biology and the fodder it eats. Mining ore out of the ground is the same idea: nature has already made the product, and the activity is simply extracting or growing it. Cultivation, dairy farming, fishing, forestry and mining are all primary-sector activities.
1.2 Secondary sector
The secondary sector covers activities where a natural product is changed into a different form through manufacturing. Because factories, workshops and industries are where this happens, it is also called the industrial sector.
Cotton fibre is spun into yarn and woven into cloth. Sugarcane is processed into sugar or gur. Earth is turned into bricks, and bricks into buildings. In every case, nature supplies the raw material but a person has to make the final product through some process of manufacturing, whether in a factory, a small workshop or even at home.
1.3 Tertiary sector
The tertiary sector does not produce a good by itself. It supports and helps the primary and secondary sectors work, for example by transporting, storing, financing or selling what they produce. Because it produces a service rather than a good, it is also called the service sector.
Once cotton is grown and cloth is woven, someone still has to move it by truck or train, store it in a godown, sell it in a shop, insure it, or arrange the payment through a bank. Transport, storage, communication, banking and trade are all tertiary activities: none of them make a new physical good, but they are an aid or a support for production and trade.
The tertiary sector also includes many services that do not directly help produce goods at all, but that every society still needs: teachers, doctors, washermen, barbers, cobblers, lawyers, and people doing administrative and accounting work. In recent years, information-technology-based services such as internet cafes, ATM booths, call centres and software companies have also become an important part of this sector.
The chapter’s Let’s Work These Out (question 3) asks you to classify occupations such as potter, bee-keeper, courier and priest. Ask yourself: is nature doing the main work (primary), is someone manufacturing something (secondary), or is the activity a service that supports others (tertiary)? A potter shapes clay into pots, that is manufacturing, so potter is secondary, not primary.
1.4 The sectors depend on each other
These three sectors do not work in isolation. They are highly interdependent, so a problem in one sector quickly affects the others.
| If this happens | What it shows |
|---|---|
| Farmers refuse to sell sugarcane to a sugar mill | The secondary (industrial) sector depends on the primary sector for raw material |
| Companies stop buying Indian cotton and import it instead | Indian cotton farmers lose income and may go bankrupt: the primary sector depends on secondary-sector demand |
| The price of fertilisers or pumpsets goes up | Farming costs rise and farmers’ profits fall: the primary sector depends on goods made in the secondary sector |
| Transporters go on strike and lorries stop carrying vegetables and milk from villages | Cities run short of food while farmers cannot sell what they grow: both other sectors depend on the tertiary sector |
2Comparing the Three Sectors: GDP and GVA
2.1 Why we measure value, not quantity
Once we have grouped activities into three sectors, the next question is how much each sector actually produces, and how many people it employs. But you cannot add up cars, computers, nails and furniture into one number; that would not make sense. So economists add up the value of everything produced instead of the number of items.
If 10,000 kg of wheat is sold at ₹20 per kg, its value is ₹2,00,000. If 5,000 coconuts are sold at ₹15 each, their value is ₹75,000. The values of every good and service in a sector are calculated this way, and then added up.
2.2 Final goods and intermediate goods
There is one important precaution: not every good that is bought and sold should be counted. Only final goods and services are counted, because counting every stage would count the same value more than once.
The biscuits are the final good, the one that actually reaches the consumer. The wheat and the flour are intermediate goods: they are used up in making the biscuits, and their value is already included inside the ₹80. Counting the value of the wheat, then the flour, then the biscuits separately would count the same wheat three times over.
Intermediate goods are goods that are used up in producing other, final goods and services, rather than being sold to the final consumer as they are.
2.3 GDP and GVA
Gross Domestic Product (GDP) is the value of all final goods and services produced within a country during a particular year. It is the standard way of showing how big an economy is. In India, GDP is estimated by a central government ministry, with the help of departments across every state and union territory.
Gross Value Added (GVA) measures the contribution of the three sectors to the economy after adjusting for taxes and subsidies. India now reports the contribution of the three sectors using GVA, in place of GDP, to match global practice. (The detailed difference between GDP and GVA is studied in higher classes. In this chapter we only look at how goods and services produced in the three sectors have changed.)
3Historical Change in Sectors
Looking at the history of countries that are developed today, a clear pattern shows up.
As farming methods improved, agriculture produced more food than before with fewer people, freeing others to take up trading and craft work. Over time, factories came up and people who had worked on farms moved into them: the secondary sector became the biggest source of production and jobs. Then, over roughly the last hundred years, developed countries have seen a further shift from secondary to tertiary: today, in those countries, the service sector produces the most and employs the most people.
4The Three Sectors in India Today
4.1 Total production has grown hugely
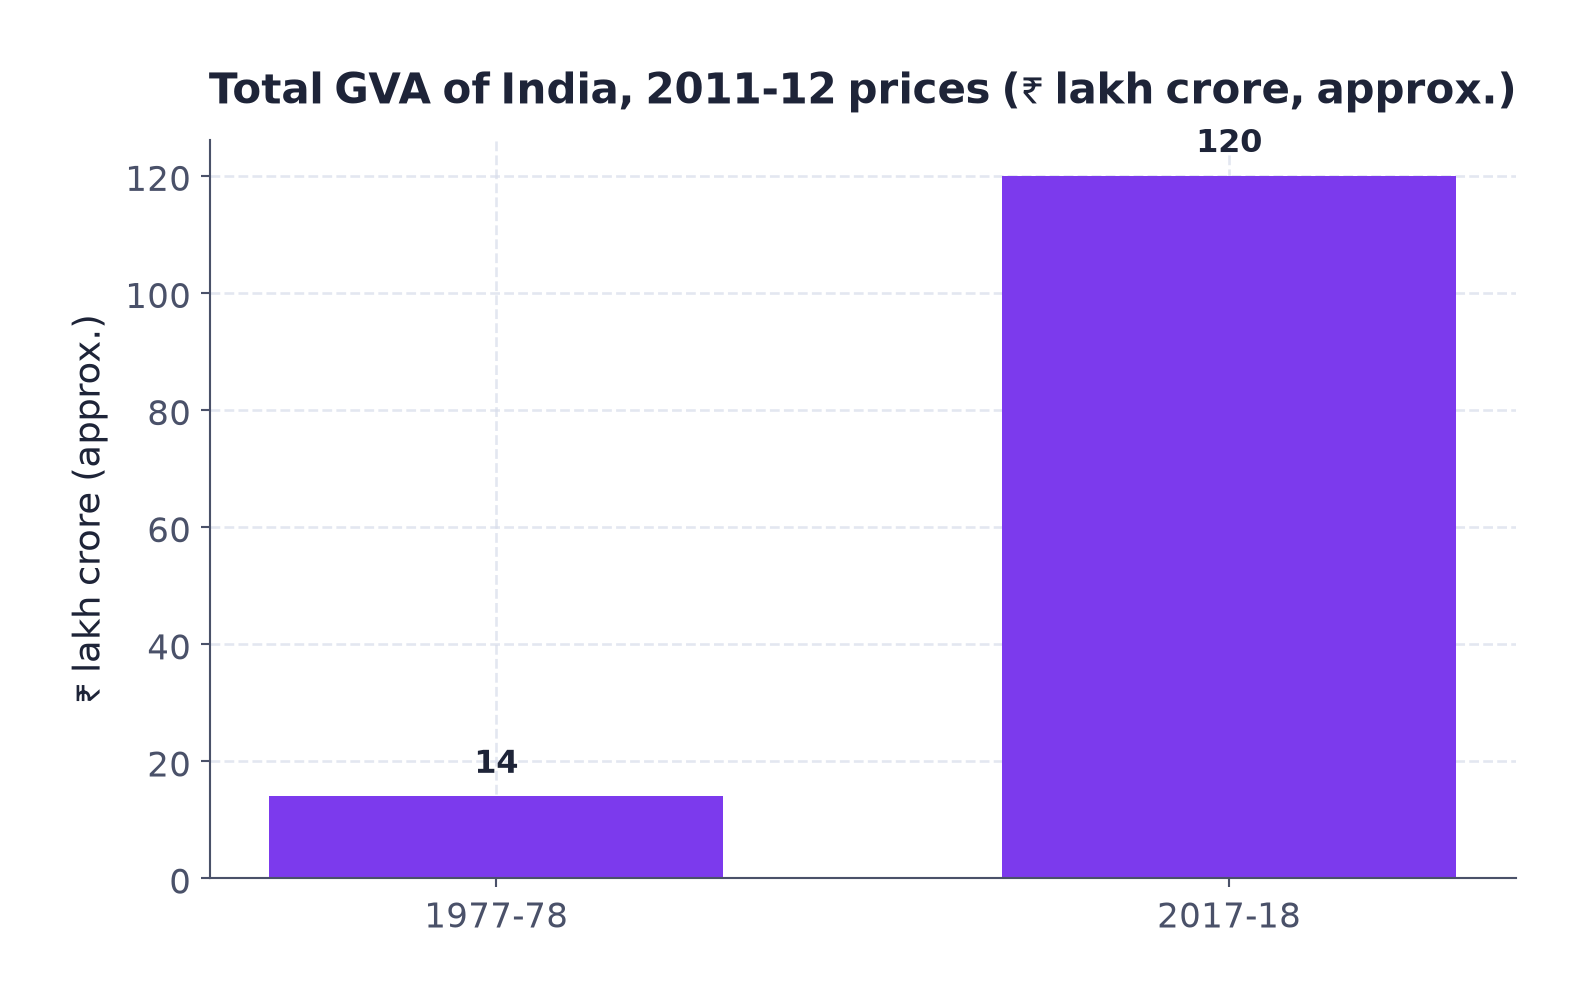
The book compares the value of goods and services produced in India in two years, 1977-78 and 2017-18, because reliable, comparable data exists for both. Reading the chapter’s own bar chart, the total GVA of all three sectors together grew from roughly ₹14 lakh crore in 1977-78 to roughly ₹120 lakh crore in 2017-18, at 2011-12 prices.
The chapter’s Graph 2 shows how the three sectors’ share of GVA changed over these forty years. Just like the total-GVA chart above, this particular graph in the book carries no printed percentage labels, only gridlines, so the values below are careful readings against those gridlines and should be treated as approximate.
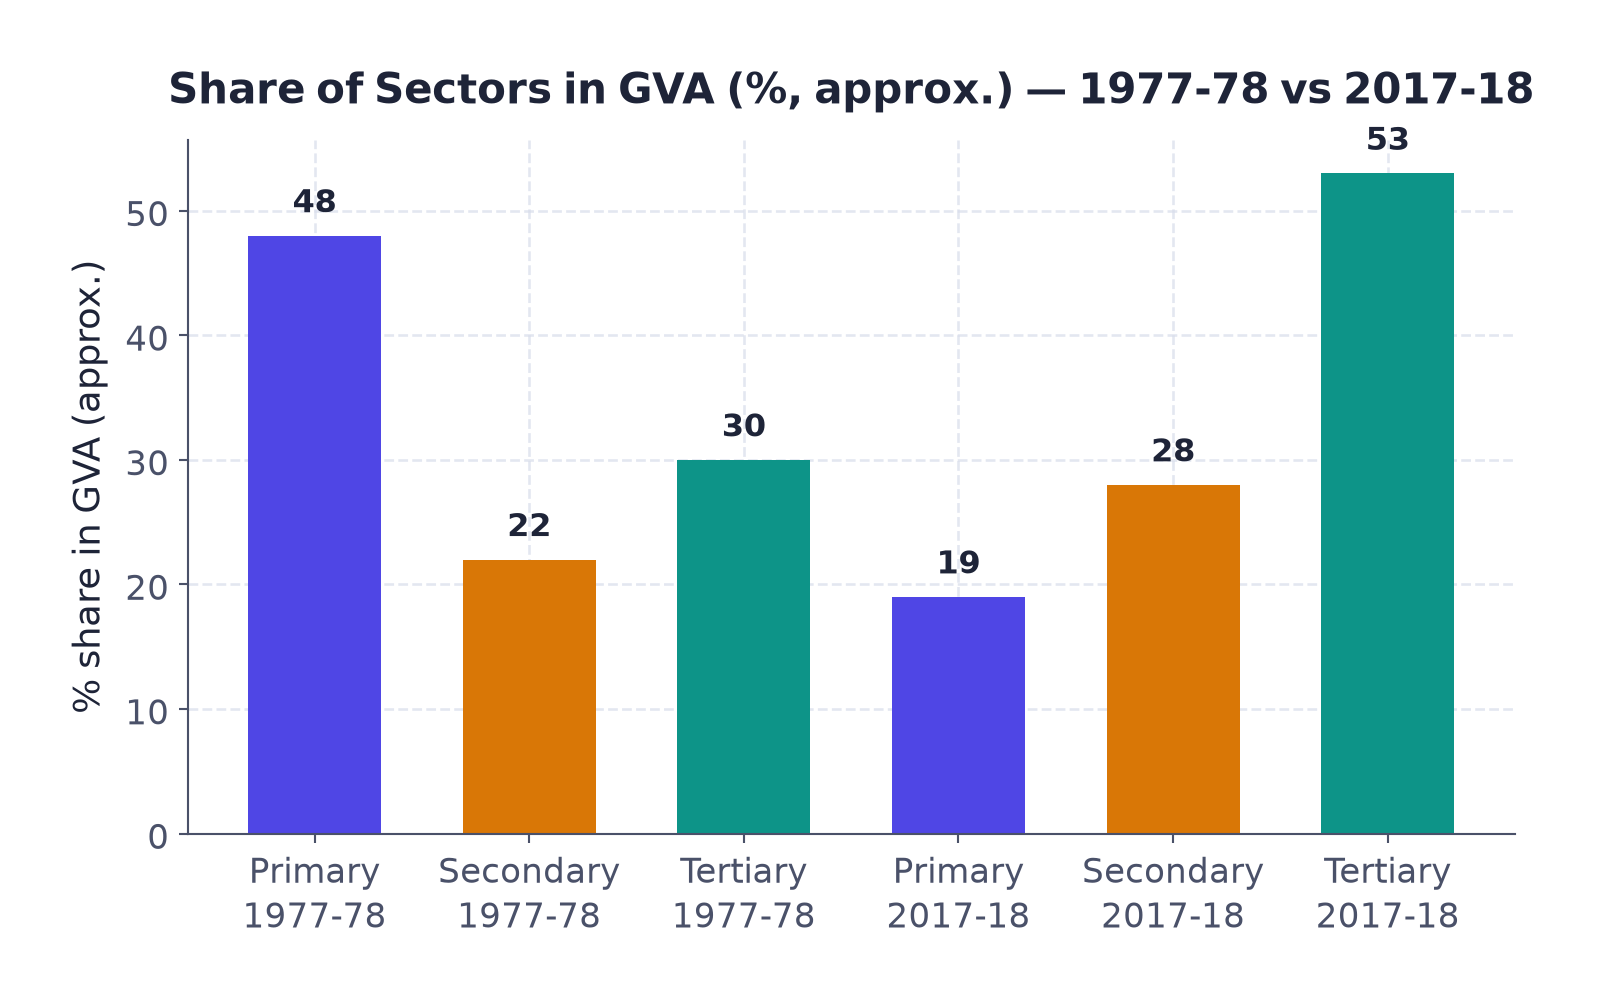
You don’t need to memorise the exact GVA percentages, since the book itself doesn’t print them. What you must remember is the conclusion: over these forty years, the tertiary sector’s share of GVA rose sharply and overtook the primary sector, which fell sharply. This is exactly the kind of “which sector grew the most” question the chapter’s own exercises ask.
Unlike Graph 2, the chapter’s Graph 3 does print exact percentages on the bars, so these numbers are exact, not estimates.

Even though tertiary overtook primary in GVA, the same shift did not happen in employment. In 2017-18 the primary sector still employed the largest single share of workers (44%), more than either secondary (25%) or tertiary (31%) on their own, even though, in the chapter’s words, it was “producing only about one sixth of the GVA” (Graph 2, which has no printed labels, reads a little under one-fifth).
The chapter’s text says “more than half of the workers in the country are working in the primary sector”. Graph 3 prints the 2017-18 primary-sector employment share as 44%, the largest single share of the three sectors. When asked for the share, quote Graph 3’s printed figure of 44%; the chapter’s own words for the primary sector are that it “continues to be the largest employer even now”.
4.4 Why the tertiary sector is growing so fast in India
Basic services
Every country needs hospitals, schools, post offices, police, courts, village offices, municipal corporations, defence, transport, banks and insurance. In a developing country, the government has to take responsibility for providing these services.
Support for the other sectors
As primary and secondary activity grows, it creates more demand for transport, trade and storage services to move and sell what they produce.
Rising incomes
As people earn more, they start spending on eating out, tourism, shopping, private hospitals and schools, and professional training, especially visible in big cities.
New IT-based services
Over the past decade or so, information and communication technology services have grown rapidly and become essential to daily life and business.
Not every part of the service sector is growing equally well. At one end are a limited number of services that employ highly skilled and educated workers. At the other end are very large numbers of workers, such as small shopkeepers, repair persons and transport workers, who barely earn a living but keep doing this work because no better opportunity is available to them.
4.5 Why employment didn’t shift the way production did
The reason primary-sector employment stayed high is that not enough new jobs were created in secondary and tertiary activities to absorb the workers moving out of farming.
Production in industry and services grew far faster than the number of jobs they created. With not enough new jobs opening up elsewhere, most workers stayed in agriculture, even though there was not enough farm work to keep them all fully occupied. That situation is explained next.
5Underemployment (Disguised Unemployment)
Underemployment, also called disguised unemployment, is a situation where people appear to be working, and nobody looks idle, but in fact each person is working below their real potential because the available work has to be divided among too many people. Removing some of these people would not reduce total output.
Laxmi is a small farmer who owns about two hectares of unirrigated land, dependent only on rain, and grows jowar and arhar. All five members of her family work on this plot throughout the year because they have nowhere else to go. Everyone is “working,” but the labour is divided so thinly that no one is fully employed. This is underemployment.
Now suppose a landlord, Sukhram, hires one or two of Laxmi’s family members to work on his own land. Laxmi’s family earns extra wages, and yet production on their own small plot does not fall, because those two people were never really needed there. This shows those two were underemployed: the farm did not need five workers.
Underemployment is not limited to farming. It is common among casual urban service-sector workers too, such as painters, plumbers and repair persons who do not find work every day, or street vendors who spend a whole day earning very little because they have no better opportunity.
5.1 Disguised unemployment vs open unemployment
Disguised (hidden) unemployment
- The person appears to be working
- Output would not fall if they left
- Example: Laxmi’s family before Sukhram hires two of them
Open unemployment
- The person has no job at all
- They are clearly, visibly without work
- Easier to notice and count than disguised unemployment
6How to Create More Employment
6.1 Four practical ways
Irrigation
A government-funded or bank-loan-funded well lets Laxmi grow a second (rabi) wheat crop. One hectare of wheat provides employment to 2 people for 50 days (sowing, watering, fertiliser application and harvesting). A dam-and-canal project can generate large-scale farm employment the same way.
Cheap agricultural credit
Without affordable bank credit, farmers like Laxmi must borrow from moneylenders at high interest for seeds, fertiliser and equipment. Reasonable-rate bank credit removes this burden (this is developed further in the next chapter, Money and Credit).
Better transport and storage
Government investment in roads, transport and storage lets farmers sell more of what they grow in nearby towns, creating jobs in transport and trade as well as farming.
Rural, non-farm industry
Setting up a dal mill for arhar and chickpea, a cold storage for potatoes and onions, honey-collection centres near forests, or processing units for potato, rice, wheat and fruit, can create jobs in semi-rural areas without needing a big city.
Better health services would also create jobs: to improve the health situation, the chapter says we need many more doctors, nurses and health workers to work in rural areas.
The Mahatma Gandhi National Rural Employment Guarantee Act, 2005 (MGNREGA 2005) guaranteed 100 days of paid employment in a year, in rural areas, to all those who are able to, and are in need of, work; if the government failed to provide it, it had to pay an unemployment allowance instead. It was implemented in about 625 districts, and gave preference to the kind of work that would raise land productivity in future. In 2025, this Act was replaced by the Viksit Bharat-Guarantee for Rozgar and Ajeevika Mission (“Viksit Bharat-G RAM G 2025”). The book’s Exercise 17 names both: “MGNREGA 2005 or Viksit Bharat-G RAM G 2025”.
7Organised and Unorganised Sectors
This is a second, completely different way of classifying economic activity, based not on what is produced but on the conditions of employment: is the job registered, regular and protected by law, or not?
The organised sector covers enterprises registered with the government, where employment is regular and protected by laws such as the Factories Act, the Minimum Wages Act, the Payment of Gratuity Act and the Shops and Establishments Act.
The unorganised sector covers small, scattered units that are largely outside government control. Rules and regulations exist on paper but are usually not followed; pay is low and irregular, and there is no security of employment.
7.1 Kanta and Kamal: an example comparison
Kanta, organised sector
- Office job, 9:30 a.m.-5:30 p.m.
- Regular monthly salary
- Provident fund, medical and other allowances
- Paid Sunday holiday
- Given a formal appointment letter
Kamal, unorganised sector
- Daily-wage labourer at a grocery shop, 7:30 a.m.-8 p.m.
- Paid only wages, nothing else
- Not paid for days he does not work
- No leave or paid holidays
- No appointment letter; can be dismissed anytime
Organised-sector workers get paid leave, holiday pay, provident fund, gratuity, medical benefits, a safe working environment and a pension on retirement, and are paid overtime if they work extra hours. Unorganised-sector workers get none of these as a right; work can disappear in the off-season purely at the employer’s discretion. Some people in the organised sector are not employed by anyone but work on their own; they too have to register themselves with the government and follow its rules. It is also common to find many organised-sector enterprises in the unorganised sector, adopting such strategies to evade taxes and refuse to follow laws that protect labourers, and since the 1990s many workers who once had organised-sector jobs have been pushed into unorganised ones.
| Sector | Organised (millions) | Unorganised (millions) | Total (millions) |
|---|---|---|---|
| Primary | 1 | 231 (calculated) | 232 |
| Secondary | 41 | 74 | 115 |
| Tertiary | 40 | 88 | 128 |
| Total | 82 | 393 (calculated) | 475 (calculated) |
Late-1990s estimated data (Table 2.3 of the textbook). The book gives the cells shown in plain type; the values marked “(calculated)” are simple arithmetic on those same given numbers, for example Primary unorganised = 232 total minus 1 organised = 231.
From this table: the unorganised sector’s share of all workers works out to about 393 ÷ 475 ≈ 83%, so only about 17% of Indian workers are in the organised sector. This “roughly five out of six workers are unorganised” fact is worth remembering exactly as a conclusion, even though the two headline percentages are left blank in the book for you to calculate.
Rural unorganised-sector workers who most need protection include landless agricultural labourers, small and marginal farmers, sharecroppers, and artisans such as weavers, blacksmiths, carpenters and goldsmiths; nearly 80% of rural households fall in the small and marginal farmer category. Urban unorganised workers include small-scale industry workers, casual construction/trade/transport workers, street vendors, head-load workers, garment makers and rag pickers. The book also makes a specific equity point: a majority of workers from Scheduled Castes, Scheduled Tribes and other backward communities are found in the unorganised sector, facing both irregular, low-paid work and social discrimination, which is why protecting these workers matters for social development as much as economic development.
8Public and Private Sectors
This is a third way of classifying economic activity, based on who owns the enterprise and who is responsible for delivering the service.
In the public sector, the government owns most of the assets and provides the service. Its purpose is not only to earn profit; governments raise money through taxes and other ways to meet its expenses. Railways and the Post Office are examples.
In the private sector, assets are owned and services are delivered by private individuals or companies, guided mainly by the motive to earn profit. Tata Iron and Steel Company Limited (TISCO) and Reliance Industries Limited (RIL) are examples.
8.1 Why government runs some activities itself
The government takes on certain activities that the private sector will not, or should not, provide on its own:
Very high cost, hard to charge for
Roads, bridges, railways, harbours, electricity generation and irrigation dams need huge upfront spending, and collecting the cost from thousands of individual users is impractical for a private company. Government undertakes this so the facility is available to everyone.
Needed, but not profitable enough
Selling electricity at true cost could push up prices for small-scale industry to the point they shut down, so government subsidises part of the cost. Similarly, government buys wheat and rice from farmers at a fair price and sells it cheaper to consumers through ration shops (linked to Food Security, studied in Class IX).
Beyond this, there are a large number of activities that are the government’s primary responsibility: providing health and education for all (India has one of the largest illiterate populations in the world), and attending to broader human development, such as safe drinking water, housing for the poor, food and nutrition, especially in the poorest and most-ignored regions.
Both these Infant Mortality Rates are described in the book as higher than some of the poorest regions of the world. The chapter gives these facts while stating that health, education and human development are the government’s duty.
Public sector
- Government owns the assets
- Not run purely for profit
- Funded through taxes and other ways
- e.g. Railways, Post Office
Private sector
- Private individuals/companies own the assets
- Guided by the profit motive
- Funded by private capital and revenue
- e.g. TISCO, RIL
- Three sectors by nature of activity: primary (uses nature directly), secondary (manufactures), tertiary (supports/services)
- Only final goods and services are counted towards GDP, to avoid counting the same value twice through intermediate goods
- GDP = value of all final goods and services made in a country in a year; GVA adjusts this for taxes and subsidies
- Developed countries shifted primary → secondary → tertiary; India’s tertiary sector overtook primary in GVA by 2017-18, but primary is still the single largest employer
- Employment didn’t shift as fast as production because secondary and tertiary production grew much faster than the jobs they created
- Underemployment (disguised unemployment) means people look busy but are working below their real potential; removing some of them would not reduce output
- Government creates employment through irrigation, cheap credit, rural non-farm industry, and through MGNREGA 2005, which guaranteed 100 days of rural work a year (replaced in 2025 by Viksit Bharat-G RAM G 2025)
- Organised sector = registered, regular, legally protected; unorganised sector = small, scattered, largely outside government control, irregular, unprotected. Most Indian workers are in the unorganised sector
- Public sector is government-owned and not profit-only; private sector is privately owned and profit-driven. Government runs high-cost, low-profit, or essential services like health and education itself