
Covers T.R. Jain & V.K. Ohri (2026-27) ch 12. Based on NCERT Statistics for Economics, Chapter 7 (Reprint 2026-27) and the CBSE curriculum 2026-27. The UP, Bihar, Rajasthan and MP boards teach from the same book.
- What an index number is, the base period and the kinds of index numbers
- How to build a price index by the simple aggregative method (the CBSE-listed method)
- Weighted indices: Laspeyre’s, Paasche’s, the method of averaging relatives and the weighted relatives method
- The Consumer Price Index (CPI), Wholesale Price Index (WPI), Index of Industrial Production (IIP) and the Sensex
- How to find inflation, the purchasing power of money and the real wage from index numbers
- The issues in constructing an index and the uses of index numbers
1 Why we need index numbers
- Summary measures such as the mean put a whole set of data into one number. This chapter finds a summary measure of change in a group of related variables
- Rabi goes to the market after a long gap: some items have become costlier, others cheaper. Describing the change in every single item is bewildering
- Some subsectors of industry are producing more, some less. The question is: can a single figure summarise these changes? The answer is an index number
Case 1: salary
An industrial worker earned ₹1,000 in 1982 and earns ₹12,000 today. Has his standard of living risen 12 times? By how much should his salary rise to keep him as well off as before? (Answer: section 7, real wage)
Case 2: sensex
The sensex crossing 8000 is greeted with euphoria; a 600-point dip wiped ₹1,53,690 crore off investors’ wealth. What exactly is the sensex? (Answer: section 5)
Case 3: inflation
The government says the inflation rate will not speed up because of the rise in petroleum prices. How does one measure inflation? (Answer: section 7)
2 What is an index number?
An index number is a statistical device for measuring changes in the magnitude of a group of related variables. It is a measure of the average change in a group of related variables over two different situations.
- It represents the general trend of diverging ratios from which it is calculated
- The comparison may be between like categories such as persons, schools or hospitals
- It also measures changes in the value of variables: prices of a list of commodities, volume of production in different sectors of an industry, production of agricultural crops, cost of living, etc.
- Conventionally an index number is expressed in terms of percentage
The base period is the period with which the comparison is made. The value in the base period is given the index number 100. The period being compared is the current period.
- To know how much prices changed in 2005 from the 1990 level, 1990 becomes the base
- The index of any period is in proportion to the base. An index of 250 means the value is two and a half times that of the base period (a 150% rise)
- The amount by which an index exceeds 100 is the percentage rise over the base; the amount by which it is below 100 is the percentage fall (only in comparison with the base period)
Price index
- Measures and permits comparison of the prices of certain goods
- Examples: CPI, WPI
- The most widely used kind
Quantity index
- Measures changes in the physical volume of production, construction or employment
- Example: Index of Industrial Production (IIP)
- An important indicator of the level of output in the economy
3 Constructing an index number: the simple aggregative method
The principles of construction are illustrated below through price index numbers. There are two methods of constructing an index number:
Data of Example 1 (book Table 7.1):
| Commodity | Base period price (₹) | Current period price (₹) | Percentage change |
|---|---|---|---|
| A | 2 | 4 | 100 |
| B | 5 | 6 | 20 |
| C | 4 | 5 | 25 |
| D | 2 | 3 | 50 |
| Total | 13 | 18 |
- The percentage change differs for every commodity. Had it been the same for all four, one measure would have been enough
- With a large number of commodities, which is common in any real market, reporting the change in every item is confusing; a price index represents these changes by a single number
The simple aggregative price index is the sum of current period prices as a percentage of the sum of base period prices: , where and are the prices of a commodity in the current period and the base period.
Given
= 2 + 5 + 4 + 2 = 13; = 4 + 6 + 5 + 3 = 18
To find
Simple aggregative price index
- Formula: (½)
- Substitution: (½)
- Answer: = 138.5 (½)
- Interpretation: prices have risen by 38.5 per cent over the base period (½)
Q. Prices of five goods in 2020 (base) are ₹20, 40, 10, 50, 30 and in 2025 ₹25, 50, 12, 60, 33. Find the simple aggregative price index.
- = 20 + 40 + 10 + 50 + 30 = 150; = 25 + 50 + 12 + 60 + 33 = 180 (½)
- 120 (1)
- Interpretation: prices rose 20% in 2025 over 2020 (½)
3.1 Limits of the simple aggregative index
- Different units: the units of measurement of prices of various commodities are not the same (per kg, per litre, per dozen), yet they are simply added
- Unweighted: the relative importance of items is not reflected; all items are treated as having equal importance or weight
- In reality items differ in importance: food items occupy a large proportion of our expenditure
- So an equal rise in the price of a heavily weighted item and of a lightly weighted item should affect the price index differently
An index number becomes a weighted index when the relative importance of items is taken care of. An index that treats all items as equally important is an unweighted index.
- Forgetting to multiply by 100 (writing 1.385); an index is in percentage form: 138.5
- Adding the percentage changes of the goods (100 + 20 + 25 + 50 = 195) and calling it the index
- Reading an index of 138.5 as “a 138.5% rise”; the rise is 138.5 − 100 = 38.5%
4 Weighted indices (Not in CBSE 2026-27 syllabus; needed for UP, Bihar, Rajasthan and MP boards and NCERT Ex 14, 19)
Not in CBSE 2026-27 syllabus: CBSE lists only the simple aggregative method. Laspeyre’s, Paasche’s and the methods of relatives are given in full for the state boards and the NCERT exercises. The weighted relatives method is also how the CPI is built (section 5.1).
4.1 Weighted aggregative price index
- Here the weights are quantity weights: each price is multiplied by the quantity bought
- A well-specified basket of commodities is taken and its worth is calculated each year
- The basket is fixed, so a change in its total value is due to price change alone
- Different methods use baskets of different times (base or current period quantities)
Data of Example 2 (book Table 7.2):
| Commodity | ||||||||
|---|---|---|---|---|---|---|---|---|
| A | 2 | 10 | 4 | 5 | 40 | 20 | 20 | 10 |
| B | 5 | 12 | 6 | 10 | 72 | 60 | 60 | 50 |
| C | 4 | 20 | 5 | 15 | 100 | 80 | 75 | 60 |
| D | 2 | 15 | 3 | 10 | 45 | 30 | 30 | 20 |
| Total | 257 | 190 | 185 | 140 |
Laspeyre’s price index is the weighted aggregative price index that uses base period quantities () as weights:
- Formula: (½)
- Substitution: (1)
- Answer: 135.3 (½)
- Interpretation: if the expenditure on the base period basket was ₹100, the same basket now costs ₹135.3. The value of base period quantities has risen by 35.3 per cent due to price rise (½)
Paasche’s price index is the weighted aggregative price index that uses current period quantities () as weights:
- Formula: (½)
- Substitution: (1)
- Answer: 132.1 (½)
- Interpretation: if the current period basket were consumed in the base period at a cost of ₹100, it would now cost ₹132.1; prices rose by 32.1 per cent (½)
Laspeyre’s price index
- Weights: base period quantities
- The basket stays the same every year; no new quantities to collect
- 135.3 in the example
Paasche’s price index
- Weights: current period quantities
- Needs new quantities every year
- 132.1 in the example
The book: the only difference between Laspeyre’s index and Paasche’s index is the weights used. Current period quantities differ from base period quantities, so the two give different values.
Q. Good X: = 10, = 5, = 12, = 6. Good Y: = 8, = 10, = 10, = 8 (prices in ₹). Find both indices.
- = 12 × 5 + 10 × 10 = 160; = 10 × 5 + 8 × 10 = 130 (½)
- Laspeyre’s = 123.08 (1)
- = 12 × 6 + 10 × 8 = 152; = 10 × 6 + 8 × 8 = 124 (½)
- Paasche’s = 122.58 (1)
In Example 2, interchange the current period values with the base period values (the old current period becomes the base). Then Laspeyre’s = and Paasche’s = . Difference: both are now below 100, because the comparison runs the other way (the high-price period is the base). The new Laspeyre’s is the reciprocal of the old Paasche’s () and the new Paasche’s of the old Laspeyre’s ().
4.2 Method of averaging relatives
The price relative of a commodity is the ratio of its current period price to its base period price, in percent: . With only one commodity, this is the price index.
- With many commodities, the method of averaging relatives takes the average of these relatives
- With a simple average: , where n is the number of commodities
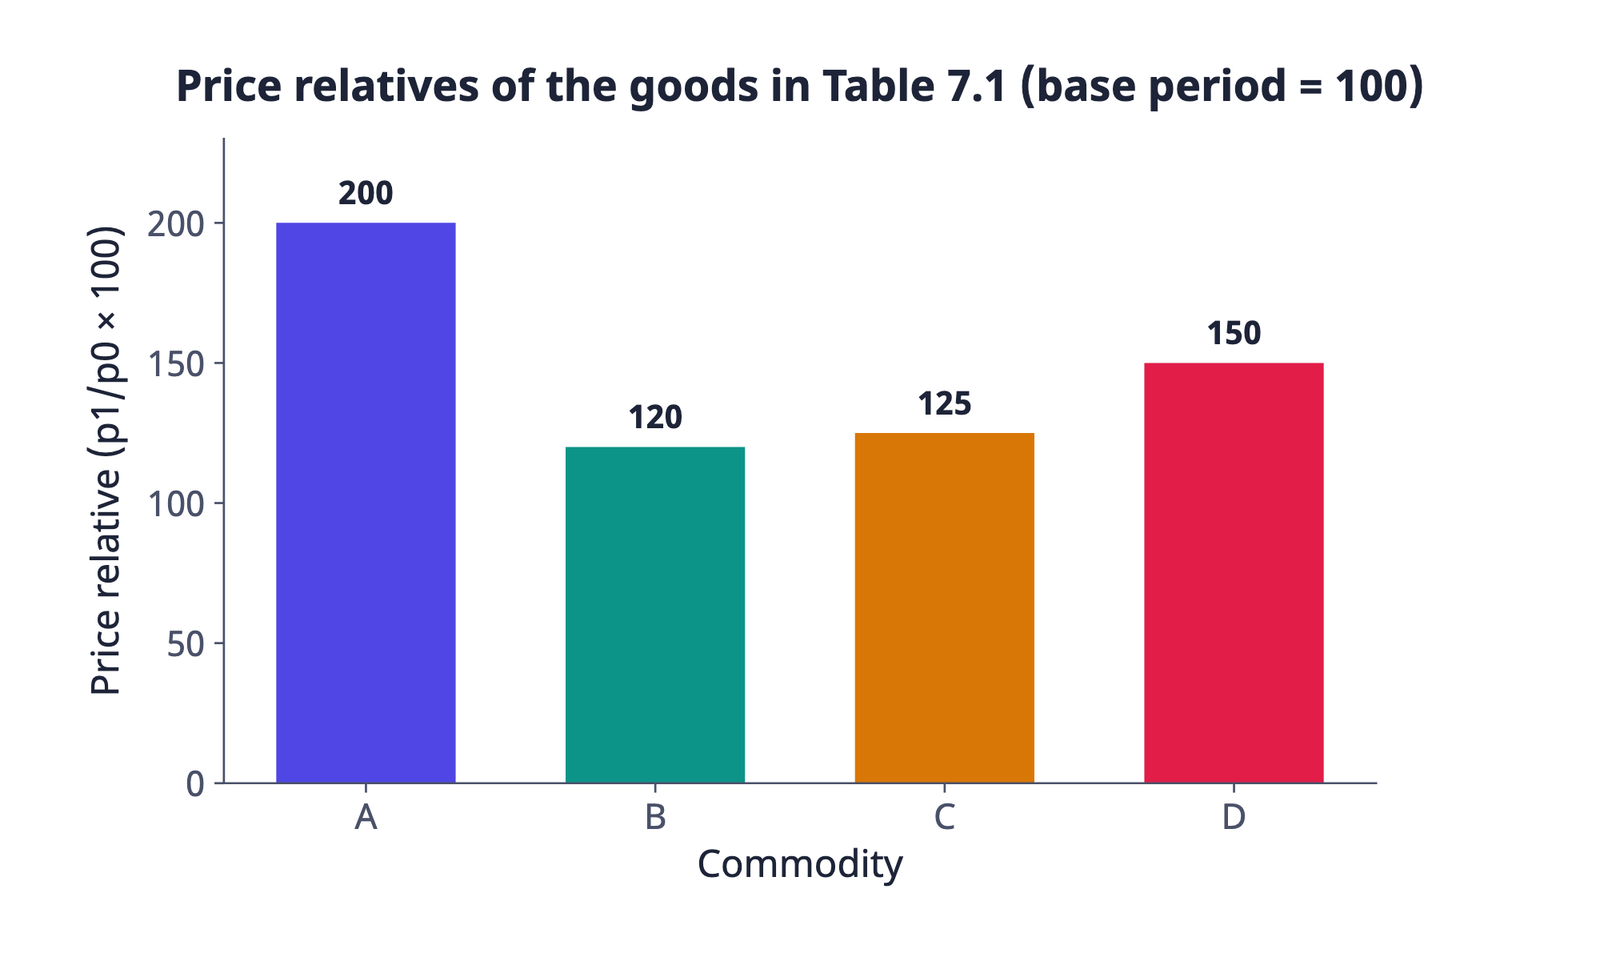
- Formula: (½)
- Substitution: (1)
- Answer: 148.75, about 149 (½)
- Interpretation: prices of the commodities have risen by about 49 per cent (½)
4.3 Weighted index of relatives
The weighted index of price relatives is the weighted arithmetic mean of price relatives: , where W is the weight and R the price relative.
- Weights are usually the proportion or percentage of expenditure on each item in total expenditure in the base period, i.e. the value shares of the commodities
- Depending on the formula, they can refer to the current period too
- Base period weights are generally preferred, because (a) calculating weights every year is inconvenient, and (b) current weights refer to the changing values of different baskets, which are strictly not comparable
| Commodity | Weight W (%) | Base year price (₹) | Current year price (₹) | Price relative R | WR |
|---|---|---|---|---|---|
| A | 40 | 2 | 4 | 200 | 8000 |
| B | 30 | 5 | 6 | 120 | 3600 |
| C | 20 | 4 | 5 | 125 | 2500 |
| D | 10 | 2 | 3 | 150 | 1500 |
| Total | 100 | 15600 |
- Formula: (½)
- Substitution: (1)
- Answer: 156 (½)
- Interpretation: the price index has risen by 56 per cent. The weighted index (156) is higher than the unweighted (149) because the most important item A (weight 40) doubled in price (½)

- Using in Laspeyre’s or in Paasche’s. Remember: Laspeyre’s = base period quantities, Paasche’s = current period quantities
- Writing over for Paasche’s; the same quantity () appears in both terms, only the price changes
- Dividing by n (the number of goods) in the weighted relatives method; divide by
- Taking the price relative as ; it is always current ÷ base
5 Some important index numbers
5.1 Consumer Price Index (CPI)
The Consumer Price Index (CPI), also known as the cost of living index, measures the average change in retail prices.
“The CPI for industrial workers (2001=100) is 277 in December 2014.” Meaning: if the industrial worker was spending ₹100 in 2001 for a typical basket of commodities, he needs ₹277 in December 2014 to buy an identical basket. It is not necessary that he buys the basket; what matters is whether he has the capability to buy it.
| Item | Weight W (%) | Base period price (₹) | Current period price (₹) | R = | WR |
|---|---|---|---|---|---|
| Food | 35 | 150 | 145 | 96.67 | 3383.45 |
| Fuel | 10 | 25 | 23 | 92.00 | 920.00 |
| Cloth | 20 | 75 | 65 | 86.67 | 1733.40 |
| Rent | 15 | 30 | 30 | 100.00 | 1500.00 |
| Misc. | 20 | 40 | 45 | 112.50 | 2250.00 |
| Total | 100 | 9786.85 |
- Formula: (½)
- Substitution: (½)
- Answer: 97.8685, about 97.87 (the book writes 97.86) (½)
- Interpretation: the index is below 100, so the cost of living has declined, by about 2.1 per cent (book: 2.14 per cent) (½)
- A CPI above 100 means a higher cost of living, needing an upward adjustment in wages and salaries
- The rise equals the amount by which the index exceeds 100: an index of 150 calls for a 50% rise in salaries
Consumer price index numbers prepared in India
Government agencies in India prepare a large number of CPIs. The six in the book:
| Index | Base | Value in May 2017 |
|---|---|---|
| CPI for Industrial Workers (CPI-IW) | 2001 = 100 | 278 |
| All-India CPI for Agricultural Labourers | 1986-87 = 100 | 872 |
| All-India CPI for Rural Labourers | 1986-87 = 100 | 878 |
| All-India Rural Consumer Index | 2012 = 100 | 133.3 |
| All-India Urban Consumer Price Index | 2012 = 100 | 129.3 |
| All-India Combined Consumer Price Index | 2012 = 100 | 131.4 |
- These indices are also available at the state level; the detailed method of each is different
- The Reserve Bank of India uses the All-India Combined Consumer Price Index as the main measure of how consumer prices are changing
- It is now prepared with base 2012 = 100, with many improvements in line with international standards
- The basket and weights come from the Modified Mixed Reference Period (MMRP) data of the Consumer Expenditure Survey (CES) 2011-12 of the 68th Round of the National Sample Survey (NSS)
- Data on the yearly rate of change of each sub-group and main group show which prices are rising most and contributing to inflation
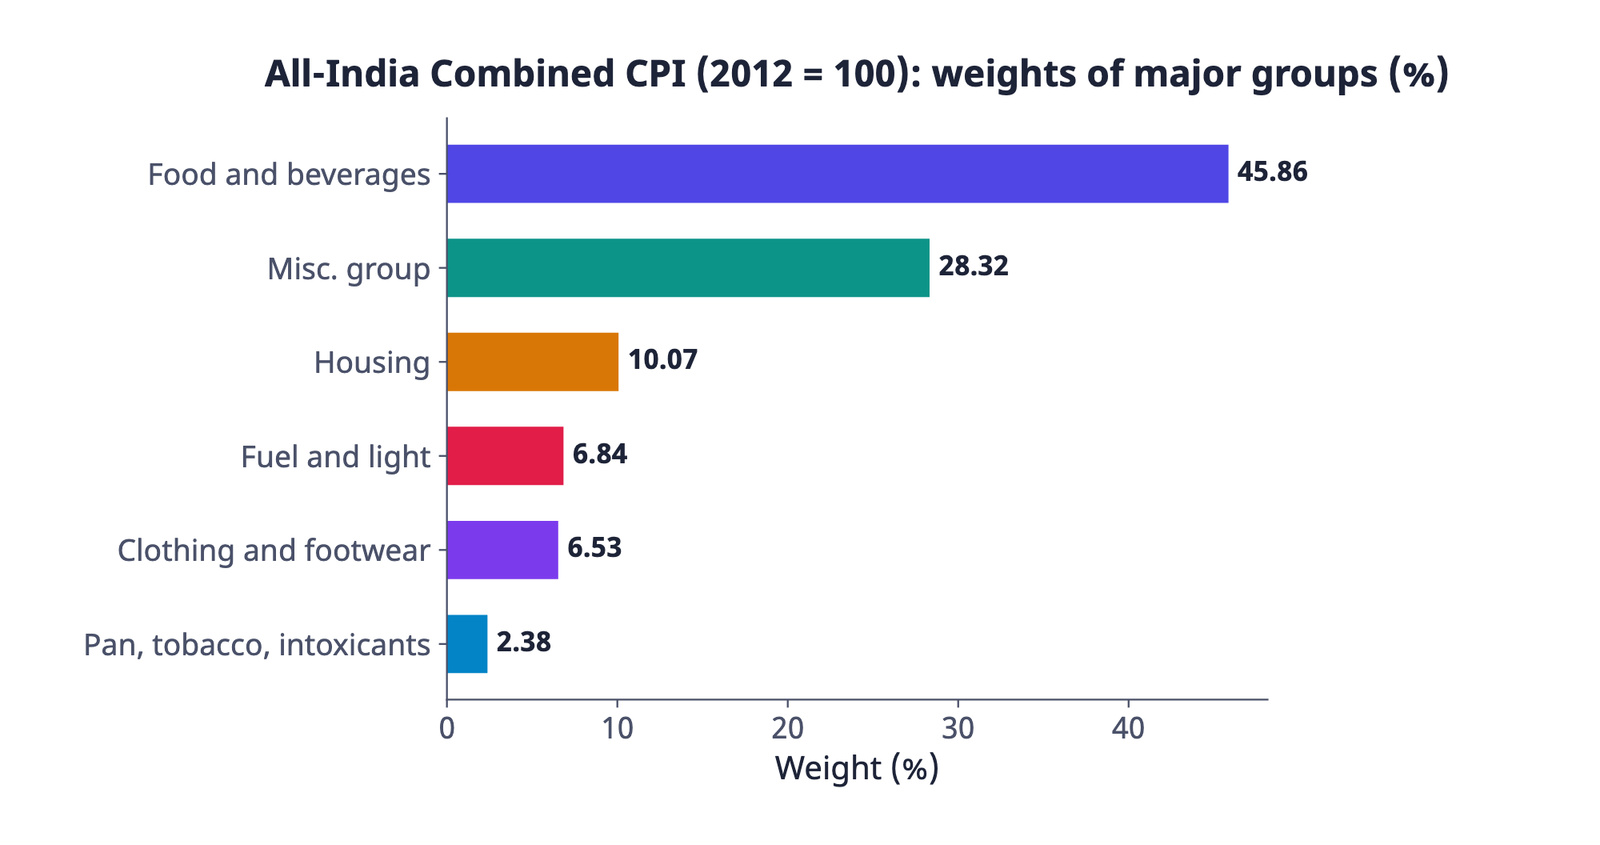
The Consumer Food Price Index (CFPI) is the same as the CPI for “Food and beverages” except that it does not include alcoholic beverages and prepared meals, snacks, sweets, etc.
5.2 Wholesale Price Index (WPI)
The Wholesale Price Index (WPI) indicates the change in the general price level. Unlike the CPI, it has no reference consumer category, and it does not include items pertaining to services such as barber charges and repairing.
- The book’s statement “WPI with 2004-05 as base is 253 in October, 2014” means the general price level rose by 153 per cent over this period (253 − 100)
- The WPI is now prepared with base 2011-12 = 100; its value for May 2017 was 112.8
- It uses prices prevailing at the wholesale level; only prices of goods are included
- Data on wholesale prices are usually available quickly
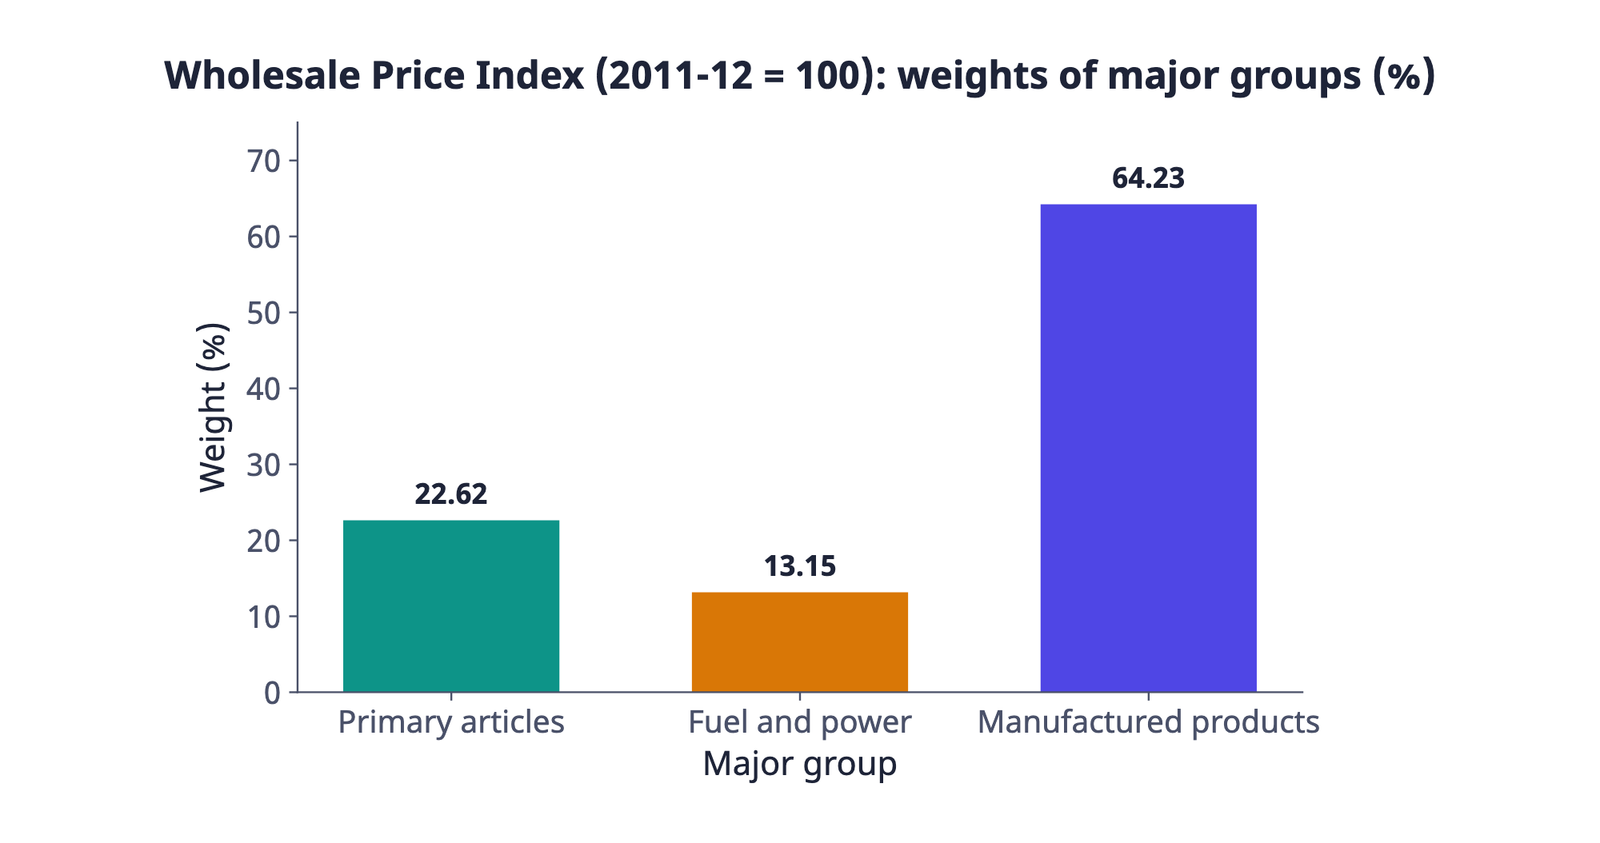
Headline inflation
The “All Commodities Inflation Rate”, i.e. the inflation rate from the whole WPI (weight 100).
WPI food index
24.23% of the total weight; made up of food articles from the primary articles group and food products from the manufactured products group.
Core inflation
Based on wholesale prices of manufactured goods other than food articles and excluding fuel; about 55% of the WPI weight.
5.3 Index of Industrial Production (IIP)
The Index of Industrial Production (IIP), unlike the CPI or WPI, tries to measure quantities. It is a weighted arithmetic mean of quantity relatives (quantity relative = ), with weights in proportion to value added by manufacture in the base year, using Laspeyre’s formula.
- With effect from April 2017 the base year is 2011-12 = 100
- Why the base year changes fast: every year many items either stop being manufactured or become inconsequential, while many new items start being manufactured
- The IIP is available for industrial sectors and sub-sectors; the main branches are Mining, Manufacturing and Electricity
- Eight core industries: coal, crude oil, natural gas, refinery products, fertilisers, steel, cement and electricity, with a combined weight of 40.27 per cent in the IIP
| Table 7.5: Weightage pattern of IIP (industrial production sectors) | Weight (%) |
|---|---|
| Mining | 14.4 |
| Manufacturing | 77.6 |
| Electricity | 8.0 |
| General index | 100.0 |

| Basis | Consumer Price Index (CPI) | Wholesale Price Index (WPI) | Index of Industrial Production (IIP) |
|---|---|---|---|
| Measures | Retail prices | Wholesale prices | Quantity of production |
| Kind | Price index | Price index | Quantity index |
| Reference consumer category | Yes (industrial workers, agricultural labourers, etc.) | None | Not applicable |
| Services | Included (e.g. housing) | Not included | Not applicable |
| Base in the book | 2012 = 100 (Combined) | 2011-12 = 100 | 2011-12 = 100 |
| Main use | Wage adjustment, real wages; RBI’s main measure | Inflation (headline), removing price effects from aggregates like national income | Change in industrial output |
5.4 Human Development Index and Sensex (Not in CBSE 2026-27 syllabus)
- Human Development Index (HDI): another useful index, widely used to know the development of a country (studied in Class X)
- Sensex: short for the Bombay Stock Exchange Sensitive Index, with 1978-79 as base; the benchmark index for the Indian stock market
- It consists of 30 stocks representing 13 sectors of the economy; the companies listed are leaders in their industries
- A rising sensex indicates that the market is doing well, investors expect better earnings, and investors have growing confidence in the basic health of the economy
6 Issues in the construction of an index number
A comparison between 1993 and 2005 is much more meaningful than one between 1960 and 2005, because many items in a typical 1960 consumption basket have disappeared. So the base year of any index is routinely updated.
7 Index numbers in economics: uses, inflation and real wage
The WPI, CPI and IIP are widely used in policy making.
| Index | Use (book) |
|---|---|
| CPI / cost of living index | Wage negotiation, formulation of income policy, price policy, rent control, taxation and general economic policy; calculating purchasing power of money and real wage |
| WPI | Eliminating the effect of price changes on aggregates such as national income and capital formation; measuring the rate of inflation |
| IIP | A quantitative figure of the change in industrial production |
| Agricultural production index | A ready reckoner of the performance of the agricultural sector |
| Sensex | A guide for investors; a rising sensex means investors are optimistic about the economy, an appropriate time for investment |
7.1 Inflation and index numbers
Inflation is a general and continuing increase in prices. Its primary impact lies in lowering the value of money. If inflation becomes large enough, money may lose its traditional functions as a medium of exchange and a unit of account.
- WPI was 150 last year and is 162 this year. Annual inflation rate?
Formula: (½); substitution: (½); answer: 8% (½); meaning: the price level rose 8% in a year (½) - In a week the WPI went from 210 to 212.1. Weekly inflation rate?
1% - CPI rose from 125 to 150. The index rose by 25 points, but the inflation rate is 20%, not 25%
- Dividing by the new index () for the inflation rate; divide by the earlier period’s index ()
- Saying “the index went from 125 to 150, so inflation is 50%”; 50% is only the comparison with the base (100). Between two non-base periods, use the formula
- Points and percent are different: 120 to 132 is 12 points but 10%
7.2 Purchasing power of money and real wage
- Purchasing power: the equivalent of a rupee in January 2005 = = ₹0.19; a 1982 rupee is worth 19 paise (1)
- Real wage: for a money wage of ₹10,000, real wage = = ₹1,901; ₹1,901 in 1982 had the same purchasing power as ₹10,000 in January 2005 (1)
- Salary adjustment: if he was getting ₹3,000 in 1982 (and ₹10,000 now), he is worse off, since keeping the 1982 standard of living needs 3000 × = ₹15,780 (1)
Q. (a) An employee’s money salary is ₹18,000 and the CPI is 240. What is his real wage? (b) Another employee earned ₹5,000 in the base year and earns ₹6,000 now; the CPI is 180. What salary keeps her old standard of living, and how big a raise does she need?
- (a) Real wage = = ₹7,500 (at base-year prices) (1)
- (b) Required salary = = ₹9,000; she gets ₹6,000, so she needs a raise of ₹3,000 (1)
- So for the worker in Case 1 (₹1,000 in 1982, ₹12,000 today): his standard of living has not risen 12 times; the answer depends on the CPI
- Multiplying the money wage by the CPI (18000 × 240 ÷ 100 = 43,200); divide by the CPI
- When asked “by how much should the salary rise”, stopping at the new salary; the rise = required salary − present salary
7.3 Where to find index numbers
Widely used index numbers, the WPI, CPI, Index Number of Yield of Principal Crops, Index of Industrial Production and Index of Foreign Trade, are available in the Economic Survey.
A family spends ₹3,500 a month on 13 items, taxed at 0%, 5%, 12%, 18% or 28% GST. The average GST rate is a weighted mean: weights = spending in each rate group, variable = the GST rate.
| Category (GST rate) | Expenditure weight W (₹) | Rate X | WX |
|---|---|---|---|
| 0% (cereals, eggs, fish/meat) | 2000 | 0 | 0 |
| 5% (medicines, biogas, transport) | 200 | 0.05 | 10 |
| 12% (butter, Babool, tomato ketchup) | 100 | 0.12 | 12 |
| 18% (biscuits, cakes/pastries, branded garments) | 200 | 0.18 | 36 |
| 28% (vacuum cleaner, car) | 1000 | 0.28 | 280 |
| Total | 3500 | 338 |
Average GST rate = = 0.0966, i.e. 9.66%.
8 Formulas, differences and revision
| Basis | Simple (unweighted) index | Weighted index |
|---|---|---|
| Importance of items | All items equal | Weights by relative importance |
| Data needed | Prices only | Prices + quantities or expenditure weights |
| Examples | Simple aggregative (138.5), simple average of relatives (149) | Laspeyre’s (135.3), Paasche’s (132.1), weighted relatives (156) |
| Usefulness | Limited | Closer to reality; CPI, WPI and IIP are all weighted |
- Index number = statistical measure of average change in a group of related variables; base period = 100
- Index 250 = two and a half times; the excess over 100 = percentage rise over the base
- Price index (CPI, WPI) vs quantity index (IIP)
- Simple aggregative = ΣP1/ΣP0 × 100; book 18/13 × 100 = 138.5
- Laspeyre’s base quantities (135.3), Paasche’s current quantities (132.1); they differ only in weights
- Price relative = P1/P0 × 100; simple average 149, weighted (ΣWR/ΣW) 156
- CPI = cost of living index, retail prices; RBI’s main measure is the Combined CPI (2012 = 100), food and beverages weight 45.86
- WPI: wholesale, goods only, no reference consumer, 2011-12 = 100; headline inflation; food 24.23%, core ~55%
- IIP: quantity, 2011-12 = 100, manufacturing 77.6; eight core industries 40.27%
- Sensex: 1978-79 base, 30 stocks, 13 sectors
- Base year: normal, no extreme values, not too far in the past
- Inflation rate = (Xt − Xt−1)/Xt−1 × 100; real wage = money wage ÷ CPI × 100
- Can I get the simple aggregative index 138.5 from Table 7.1 without looking?
- Can I put the right quantity ( / ) into Laspeyre’s and Paasche’s?
- Can I fill a full ΣWR/ΣW table for a CPI?
- Can I write three differences between the CPI, WPI and IIP?
- Can I find the inflation rate from two index values, and the real wage from the CPI?
- Can I give three desirable properties of a base year with an example?