
Exam-useful questions from this chapter, grouped by marks, each with a full model answer. Try writing the answer yourself first, then check it against this one.
1 1-Mark Questions
Q. Define the mean.
Answer: The mean is the value which is derived by summing all the values and dividing it by the number of observations.
Q. Which symbol is used to denote the median?
Answer: The median is denoted by the symbol M.
Q. What are the two symbols used for the mode?
Answer: The mode is symbolised as Z or M0.
Q. What is meant by the ‘assumed mean’?
Answer: The assumed mean is the constant subtracted from every value while computing the mean by the indirect method.
Q. What is meant by ‘coding’ while computing the mean?
Answer: Coding is the operation of reducing all the values to smaller numbers by subtracting the assumed mean from each of them.
Q. What are the three measures of central tendency?
Answer: The mean, the median and the mode are the three measures of central tendency.
Q. What are the three main statistical techniques used to analyse data?
Answer: Measures of central tendency, measures of dispersion and measures of relationship are the three techniques.
Q. What is a unimodal series?
Answer: A unimodal series is one in which only one value has the highest frequency.
2 2-Mark Questions
Q. What is the difference between the direct and the indirect methods of computing the mean?
Answer: In the direct method, all the raw values are added directly and the sum is divided by the number of observations (N). In the indirect method, an assumed mean is subtracted to reduce the values to smaller numbers, and the mean is then found from the sum of these deviations; both methods give exactly the same answer, only the indirect method simplifies the arithmetic.
Q. What are the advantages of using the mode?
Answer: The mode is simple to find, it is not affected by extreme values, and it can even be used for qualitative data (such as the most popular colour or preference), for which the mean or median cannot be computed at all.
Q. Find the mean of the following values by the direct method: 8, 12, 16, 20, 24.
Answer: Σx=8+12+16+20+24=80, N=5. X̄=80/5=16.
Q. Find the mode of the following data: 5, 9, 5, 13, 17, 5, 9.
Answer: The value 5 occurs three times (9 occurs only twice), so the mode is 5.
Q. What is the difference between a bimodal and a trimodal series?
Answer: In a bimodal series, two values occur with an equal and the highest frequency; in a trimodal series, three values occur with an equal and the highest frequency.
Q. In the formula M = l + (i/f)(N/2 − c), what do l and c stand for?
Answer: l is the lower limit of the median class; c is the cumulative frequency of the class immediately preceding the median class (the pre-median class).
Q. Find the median of the following ages (in years): 19, 23, 15, 27, 21.
Answer: Arranged: 15, 19, 21, 23, 27 (N=5); position = (5+1)/2 = 3rd item. Median = 21 years.
Q. Why does the mean shift the most of the three measures in a skewed distribution?
Answer: Because the mean is calculated using every value in the data set, including the extreme values in the long tail, while the mode simply follows the peak (highest-frequency point) of the curve and barely shifts at all; the median, being positional, shifts by a smaller amount than the mean.
3 4-Mark Questions
Q. Using an example, show why the mean comes out the same by both the direct and the indirect methods.
Answer: Take the values 24, 30, 36, 42, 48. Direct method: Σx=180, N=5, X̄=180/5=36. Indirect method: taking assumed mean A=30, deviations are -6, 0, 6, 12, 18, Σd=30, X̄=30+30/5=30+6=36. Both methods give 36, because algebraically A+Σ(x−A)/N = A+(Σx−NA)/N = Σx/N: the assumed mean A always cancels out, leaving the same quantity Σx/N either way.
Q. Find the mean by the direct method from the following grouped data: classes 0-10, 10-20, 20-30, 30-40; frequencies 4, 6, 8, 2.
Answer: Midpoints: 5, 15, 25, 35. fx: 20, 90, 200, 70. Σfx=380, N=Σf=20. X̄=380/20=19.
Q. Explain, with the formula, the method of finding the median of grouped data.
Answer: First a frequency table is set up and the cumulative frequency (F) of each class is found by adding each class’s own frequency to the running total. Then N/2 is calculated, and counting down the cumulative-frequency column, the class in which the cumulative frequency first becomes greater than N/2 is identified as the median class. Finally, the values are substituted in the formula M = l + (i/f)(N/2 − c), where l is the lower limit of the median class, i is the class interval, f is the frequency of the median class and c is the cumulative frequency of the class preceding the median class.
Q. With an example, explain how the mean, median and mode are related in a normal distribution.
Answer: A normal distribution is a perfectly symmetrical, bell-shaped curve, so the mean, median and mode all coincide at the same score. In the chapter’s own Fig. 2.1, this common score is 100, that is, X̄=M=Z=100. The score with the highest frequency occurs exactly in the middle of the distribution, with half of the observations lying above it and half below.
Q. Find the median of the following distribution: classes 0-10, 10-20, 20-30, 30-40, 40-50; frequencies 5, 9, 15, 8, 3.
Answer: Cumulative frequencies: 5, 14, 29, 37, 40. N=40, N/2=20, which first falls in the 20-30 class (cf=29), so l=20, c=14 (cumulative frequency of the preceding class), f=15, i=10. M=20+(10/15)(20−14)=20+4=24.
Q. Of the mean, median and mode, which measure is most affected by extreme values, and why?
Answer: The mean is the most affected, because its computation uses every value in the data set, including unusually large or small extreme values. The median depends only on the position of an item and the mode only on the most frequently occurring value, so both are relatively unaffected by extreme values.
Q. Find the mode of the following data and state its type: 18, 25, 18, 32, 47, 25, 18.
Answer: The value 18 occurs three times (25 occurs only twice), so the mode is 18. Since only one value has the highest frequency, this series is unimodal.
4 6-Mark Questions
Q. With the help of diagrams, explain the relative positions of the mean, median and mode in a normal distribution and in a skewed distribution.
Answer: In a normal (symmetrical) distribution, the curve is perfectly bell-shaped, so all three measures, the mean, median and mode, coincide at exactly one point at the centre of the curve (Mean = Median = Mode). When the data are skewed, this equality breaks down. In a positive skew, the curve’s long tail lies towards the higher values, which pulls the mean towards the extreme right; the mode stays closest to the peak of the curve, and the median lies between the two, giving the order: Mode < Median < Mean. In a negative skew, the curve’s long tail lies towards the lower values, which pulls the mean towards the extreme left, giving the order: Mean < Median < Mode. In both skewed cases, the mode shifts the least, since it only follows the peak of the curve, while the mean shifts the most, since its calculation includes every value, extreme values included.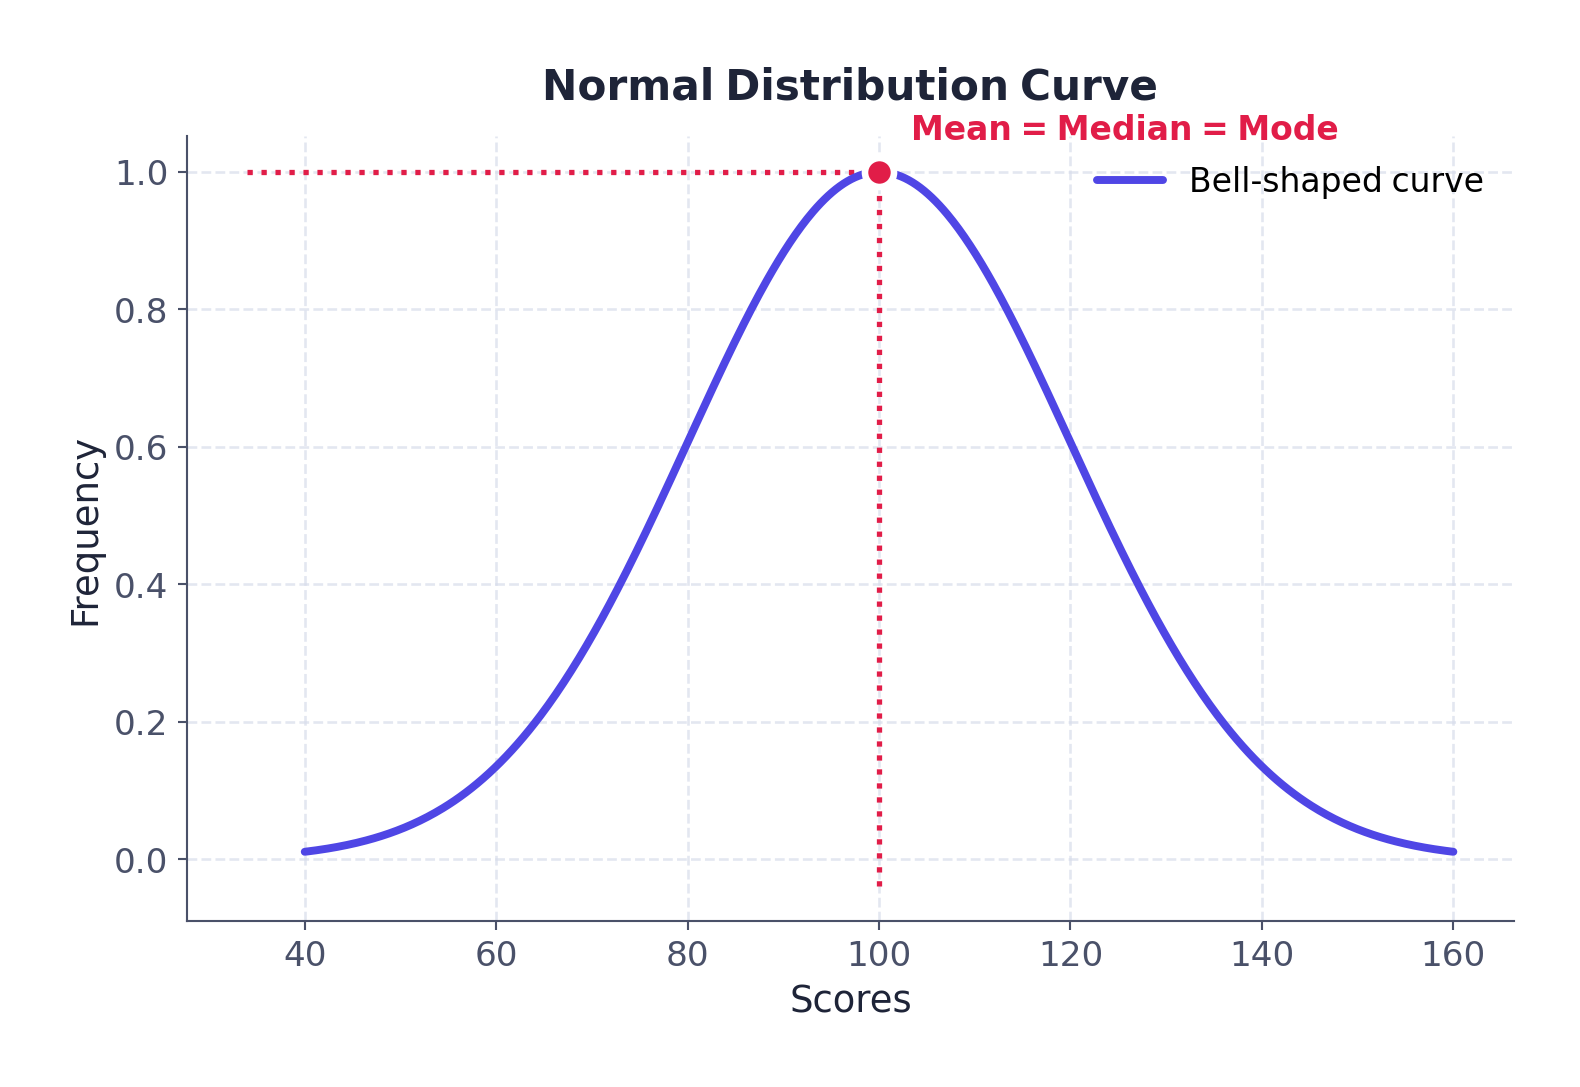 Fig. 2.1: Normal distribution
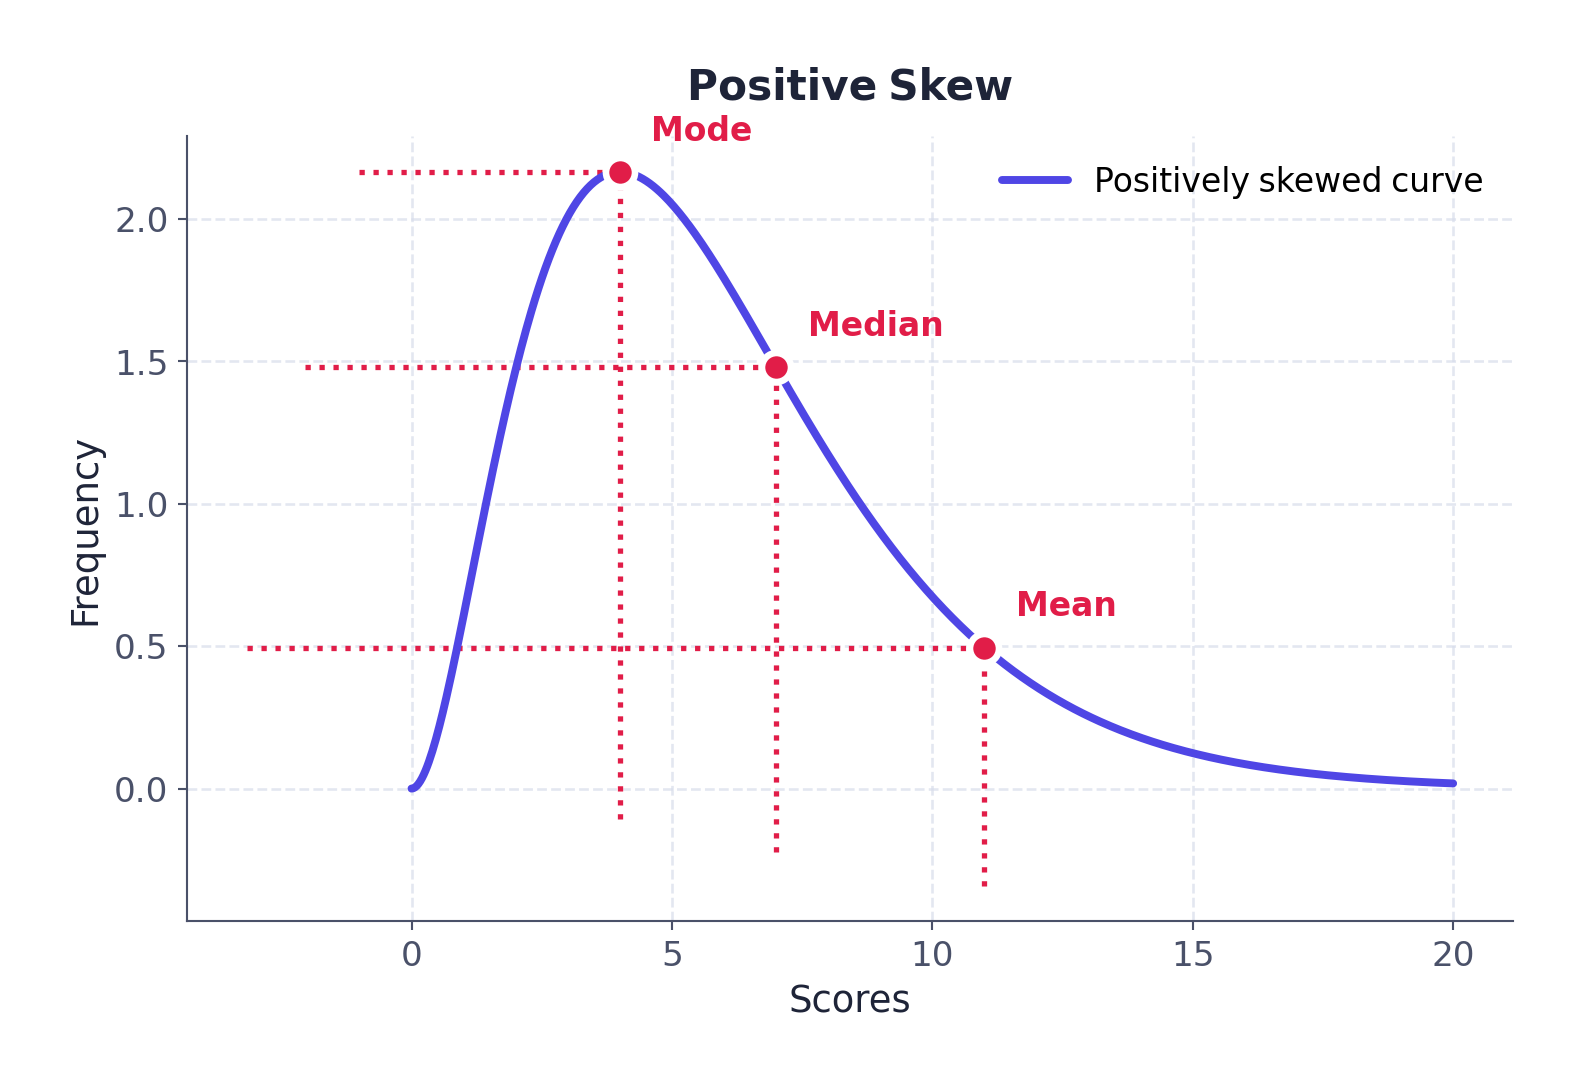 Fig. 2.2: Positive skew (Mode < Median < Mean)
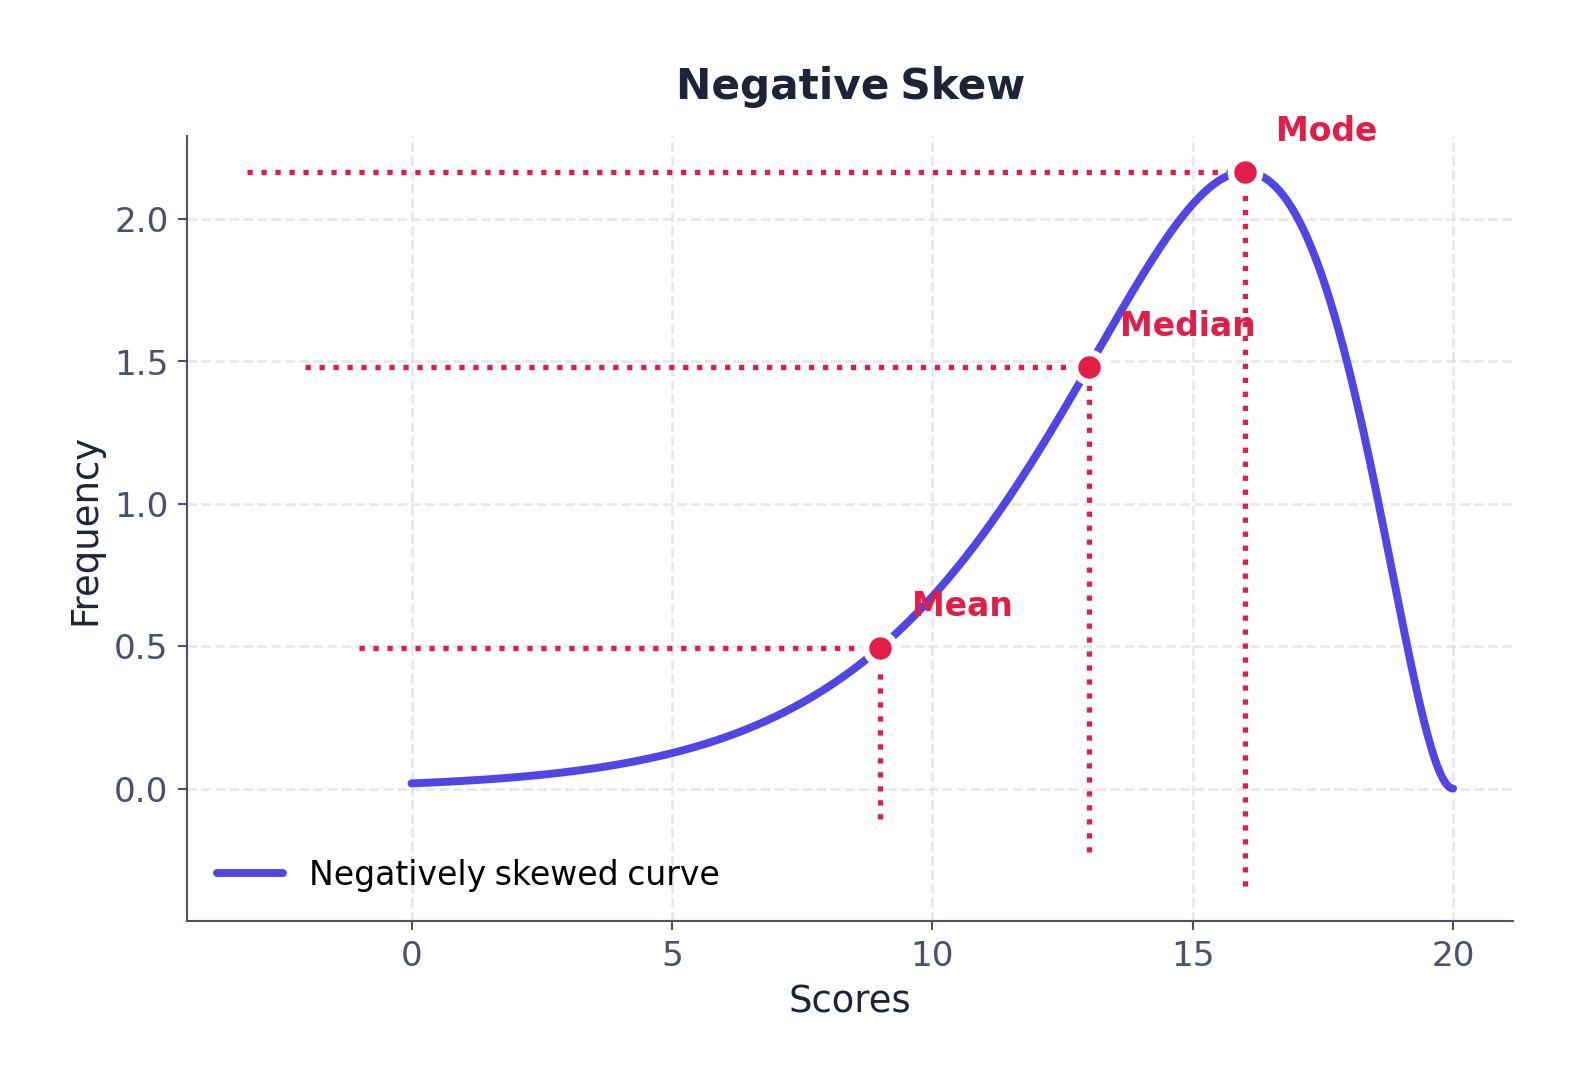 Fig. 2.3: Negative skew (Mean < Median < Mode)
Q. Comment on the applicability of the mean, median and mode, from their merits and demerits.
Answer: The mean‘s merit is that it uses every value in the data set and is the measure most used in further statistical analysis (such as measures of dispersion); its demerit is that it is heavily affected by extreme values (unusually large or small observations). The median‘s merit is that it is unaffected by extreme values, since it depends only on position, and it gives a fair representative value for skewed distributions; its demerit is that it does not use the actual value of every observation, only their order. The mode‘s merit is that it is simple to find, is unaffected by extreme values, and can even be applied to qualitative data (such as the most popular item); its demerit is that a series can have no mode at all, or more than one, which makes it a less stable and less reliable single measure. Thus, the three measures complement one another, and the appropriate one is chosen according to the nature of the data (symmetrical or skewed, quantitative or qualitative).
Q. Using a suitable imaginary example applicable to geographical analysis, explain the direct and indirect methods of computing the mean from ungrouped data, and show that the result is the same.
Answer: Suppose the population of five villages (in hundreds) is 45, 52, 58, 63, 67. Direct method: Σx=45+52+58+63+67=285, N=5. X̄=285/5=57. Indirect method: take the assumed mean A=55 (close to the middle of the series). Deviations d=x−A: −10, −3, 3, 8, 12; Σd=10. X̄=A+Σd/N=55+10/5=55+2=57. Both methods give the same mean (57 hundred, that is, 5,700), because the indirect method only simplifies the arithmetic by working with smaller numbers; it does not change the underlying total.
Q. Find the mean from the following grouped data by both the direct and the indirect methods, and show that both give the same answer: classes 20-30, 30-40, 40-50, 50-60, 60-70; frequencies 5, 9, 14, 8, 4.
Answer: Midpoints: 25, 35, 45, 55, 65. Direct method: fx: 125, 315, 630, 440, 260. Σfx=1,770, N=Σf=40. X̄=1,770/40=44.25. Indirect method: take the assumed mean class as 40-50 (A=45). Deviations d=x−A: −20, −10, 0, 10, 20; fd: −100, −90, 0, 80, 80; Σfd=−30. X̄=A+Σfd/N=45+(−30)/40=45−0.75=44.25. Both methods give the same mean, 44.25.
5 Case Studies
(A) 1 mark Find the mean rainfall of the Malwa Plateau by the direct method.
Answer: Σx=6,484, N=7; X̄=6,484/7=926.29 mm.
(B) 1 mark If the assumed mean is taken as 800, what is the sum of the deviations (d) of the seven districts?
Answer: Σd = 179+283+33+96+91+25+177 = 884.
(C) 2 marks Find the mean by the indirect method and show that it matches the answer from the direct method.
Answer: X̄ = 800 + 884/7 = 800 + 126.29 = 926.29 mm, exactly matching the direct method’s answer (926.29 mm).
(A) 1 mark What is the mode of the first group?
Answer: 61, because this value occurs three times, more often than any other value in the group.
(B) 1 mark How many modes does the second group have, and what are they?
Answer: The second group has two modes: 11 and 82, each occurring three times.
(C) 2 marks What is the second group’s series called, and why?
Answer: It is called a bimodal series, because two values (11 and 82) each occur with an equal and the highest frequency (three times each).