Processing
- Why raw data needs to be reduced to a single representative number, and the three families of statistical technique used to analyse it
- How to compute the mean by the direct and indirect methods, for both ungrouped and grouped data
- How to locate the median of a series, and calculate it exactly for grouped data using the median formula
- How to find the mode, and tell a unimodal series from a bimodal, trimodal or multimodal one
- How mean, median and mode relate to each other in a normal distribution, and how that relationship changes when data is skewed
direct methodindirect methodassumed meanclass interval
cumulative frequencyunimodalbimodalnormal distribution
positive skewnegative skew
1Measures of Central Tendency
Organising and presenting data makes it easier to understand: that is data processing. To actually analyse data, geographers use three families of statistical technique: measures of central tendency (one value that best represents a whole set), measures of dispersion (how spread out the data is around that value) and measures of relationship (how strongly two variables like rainfall and floods are connected). This chapter covers only the first of the three: measures of central tendency.
Measures of central tendency are the statistical techniques used to find the single value, usually near the centre of a distribution, that best represents the entire data set. They are also called statistical averages. The three main measures are the mean, the median and the mode.
A characteristic like rainfall, elevation or population density varies from place to place. A single representative number lets us compare one district, one year or one region against another without listing every raw value. That number is called the central tendency because it is the point around which the individual values tend to cluster.
2Mean
The mean () is the simple arithmetic average of a set of values: the value obtained by summing all the observations and dividing by the number of observations. Mean can be calculated by a direct or an indirect method, for both ungrouped and grouped data.
2.1 Computing mean from ungrouped data: direct method
All the raw values are added and the sum is divided by the number of observations.
Normal rainfall (mm) of 7 districts: Indore 979, Dewas 1,083, Dhar 833, Ratlam 896, Ujjain 891, Mandsaur 825, Shajapur 977.
, and .
926.29 mm
2.2 Computing mean from ungrouped data: indirect method
For a large number of observations, values are first reduced to smaller numbers by subtracting a constant, called the assumed mean, from each of them. This is known as coding.
Take assumed mean . Deviations : 179, 283, 33, 96, 91, 25, 177. .
926.29 mm
The mean comes out the same by either method: the indirect method only makes the arithmetic easier for large numbers.
2.3 Computing mean from grouped data: direct method
When data is grouped into a frequency distribution, individual values lose their identity and are represented by the midpoint of the class interval they fall in.
| Class (₹/day) | Midpoint | ||
|---|---|---|---|
| 50-70 | 10 | 60 | 600 |
| 70-90 | 20 | 80 | 1,600 |
| 90-110 | 25 | 100 | 2,500 |
| 110-130 | 35 | 120 | 4,200 |
| 130-150 | 9 | 140 | 1,260 |
, .
₹102.6 / day
2.4 Computing mean from grouped data: indirect method
Assumed-mean class = 90-110, so (its midpoint). Deviations give values −400, −400, 0, 700, 360, so .
102.6, the same answer as the direct method.
Whichever method is used, the final mean is always identical: that itself is a common 1-mark or 2-mark question (“show that the mean is the same by both methods”).
3Median
The median (symbol ) is a positional average: the value of the item that has an equal number of observations on either side of it, once the data is arranged in ascending or descending order.
3.1 Median for ungrouped data
Heights (m): 8,126; 8,611; 7,817; 8,172; 8,076; 8,848; 8,598. Here .
Arranged in ascending order: 7,817; 8,076; 8,126; 8,172; 8,598; 8,611; 8,848.
Position th item.
8,172 m (the 4th value in the arranged series)
3.2 Median for grouped data
| Class | Cumulative frequency | |
|---|---|---|
| 50-60 | 3 | 3 |
| 60-70 | 7 | 10 |
| 70-80 | 11 | 21 |
| 80-90 (median class) | 16 | 37 |
| 90-100 | 8 | 45 |
| 100-110 | 5 | 50 |
, so . This falls in class 80-90, so , , , and (cumulative frequency of the class before it).
82.5
4Mode
The mode (symbol or ) is the value that occurs most frequently in a distribution. It is used less often than mean or median, and a series can have more than one mode.
To find the mode of ungrouped data, arrange all the values in ascending or descending order, which makes the most frequently repeated value easy to spot.
Geography test scores of 10 students: 61, 10, 88, 37, 61, 72, 55, 61, 46, 22.
Arranged: 10, 22, 37, 46, 55, 61, 61, 61, 72, 88. The value 61 repeats three times, more than any other, so it is the mode. As no other value repeats this often, the series is unimodal.
Scores of another 10 students: 82, 11, 57, 82, 08, 11, 82, 95, 41, 11.
Arranged: 08, 11, 11, 11, 41, 57, 82, 82, 82, 95. Both 11 and 82 repeat three times each, so the series is bimodal.
4.1 Types of mode
Unimodal
Exactly one value has the highest frequency in the series.
Bimodal
Two values are tied for the highest frequency.
Trimodal
Three values have equal and highest frequency.
Multimodal
Many values recur with equal, highest frequency.
Without mode
No value in the series repeats at all.
5Comparison of Mean, Median and Mode
The three measures of central tendency can be compared using the normal distribution curve: a symmetrical, bell-shaped frequency curve. Many human traits, such as intelligence, personality scores and student achievement, follow this shape.
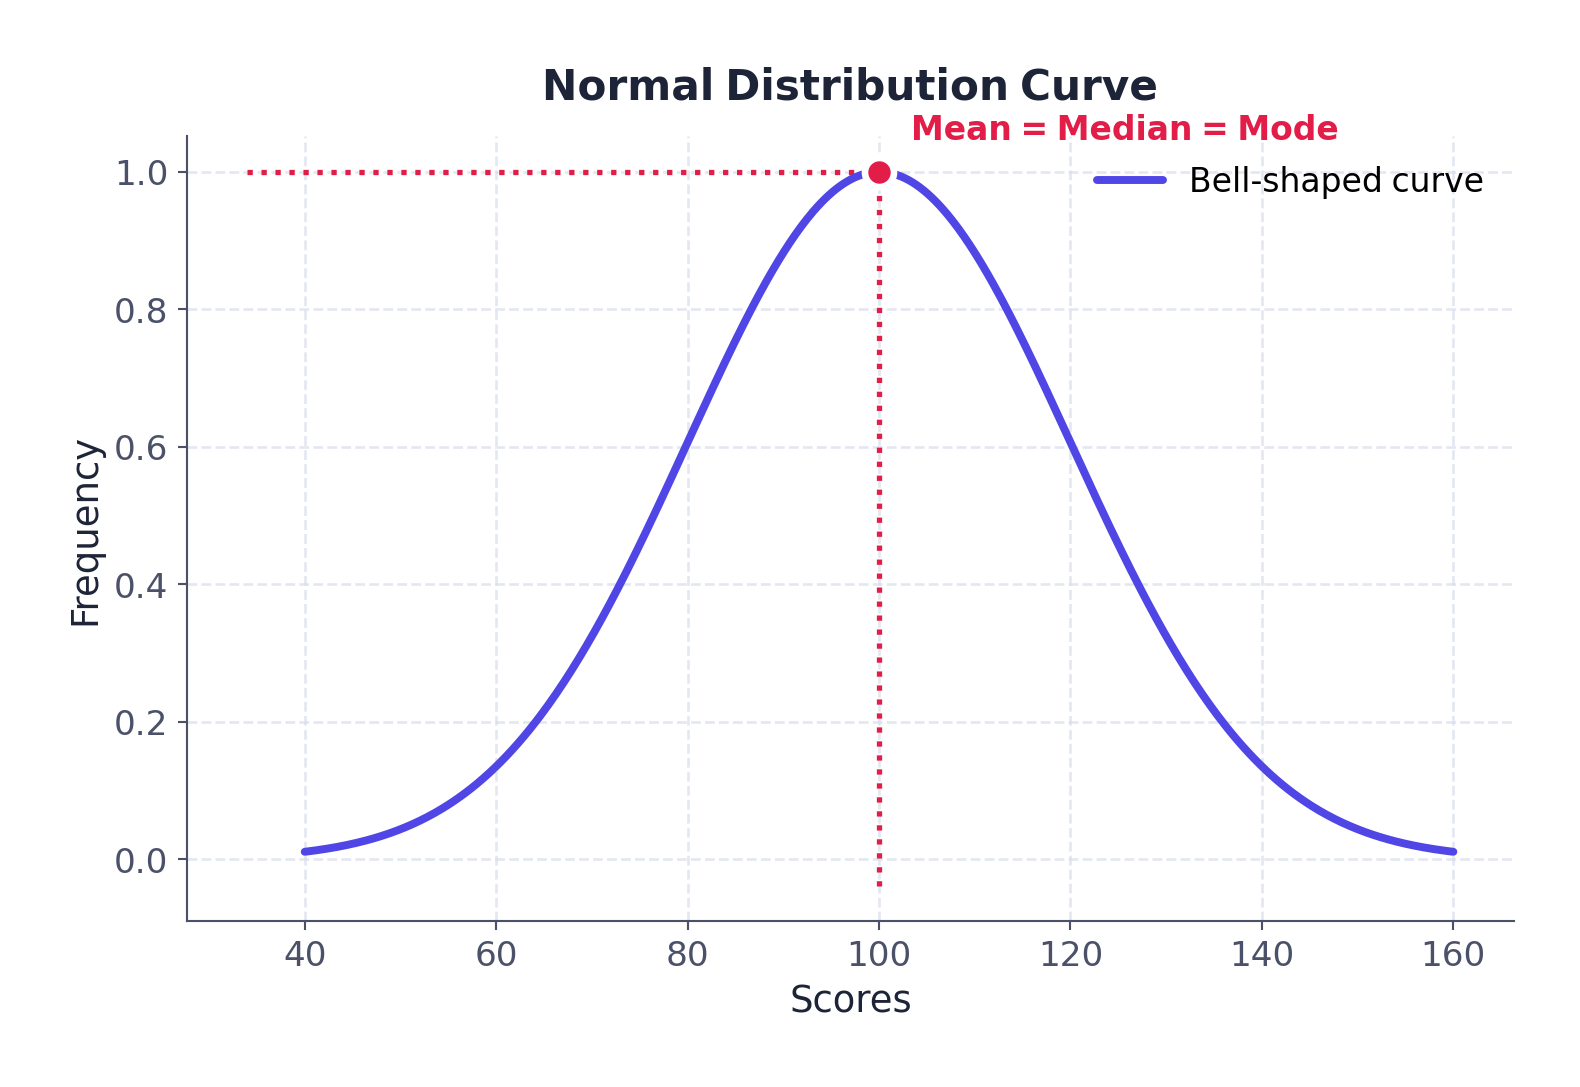
Because a normal distribution is symmetrical, the value with the highest frequency sits exactly in the middle, with exactly half the observations above it and half below. So Mean = Median = Mode. Very high and very low scores are rare on both sides.
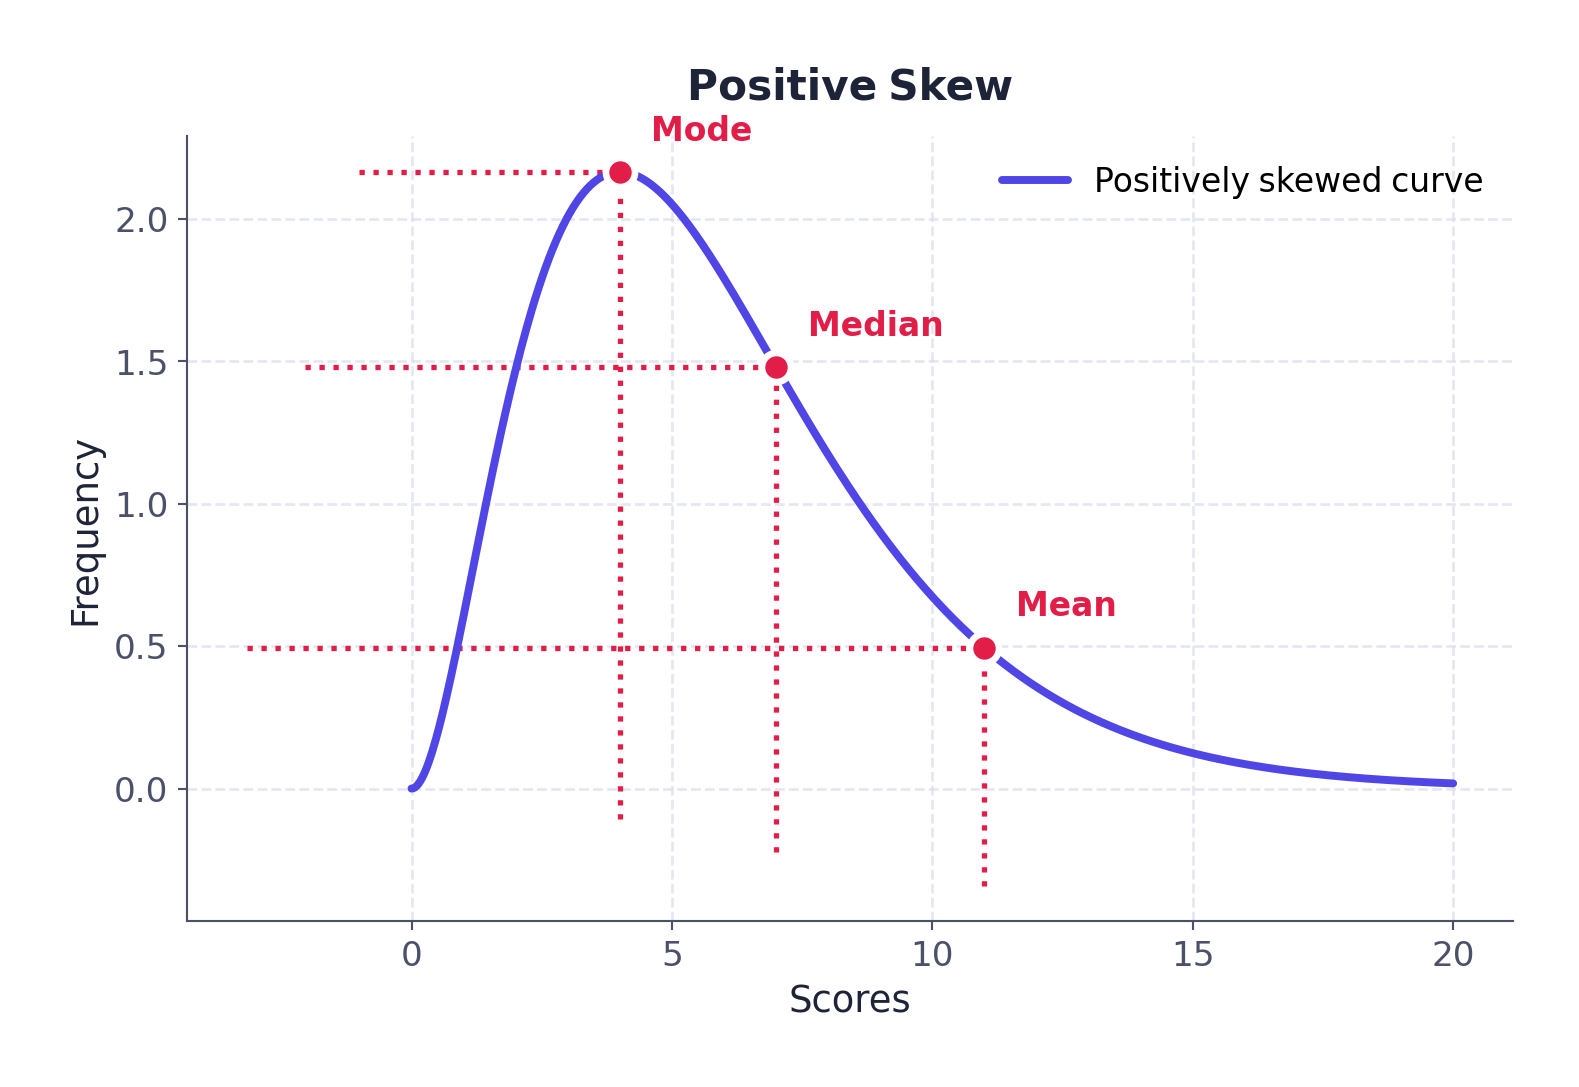
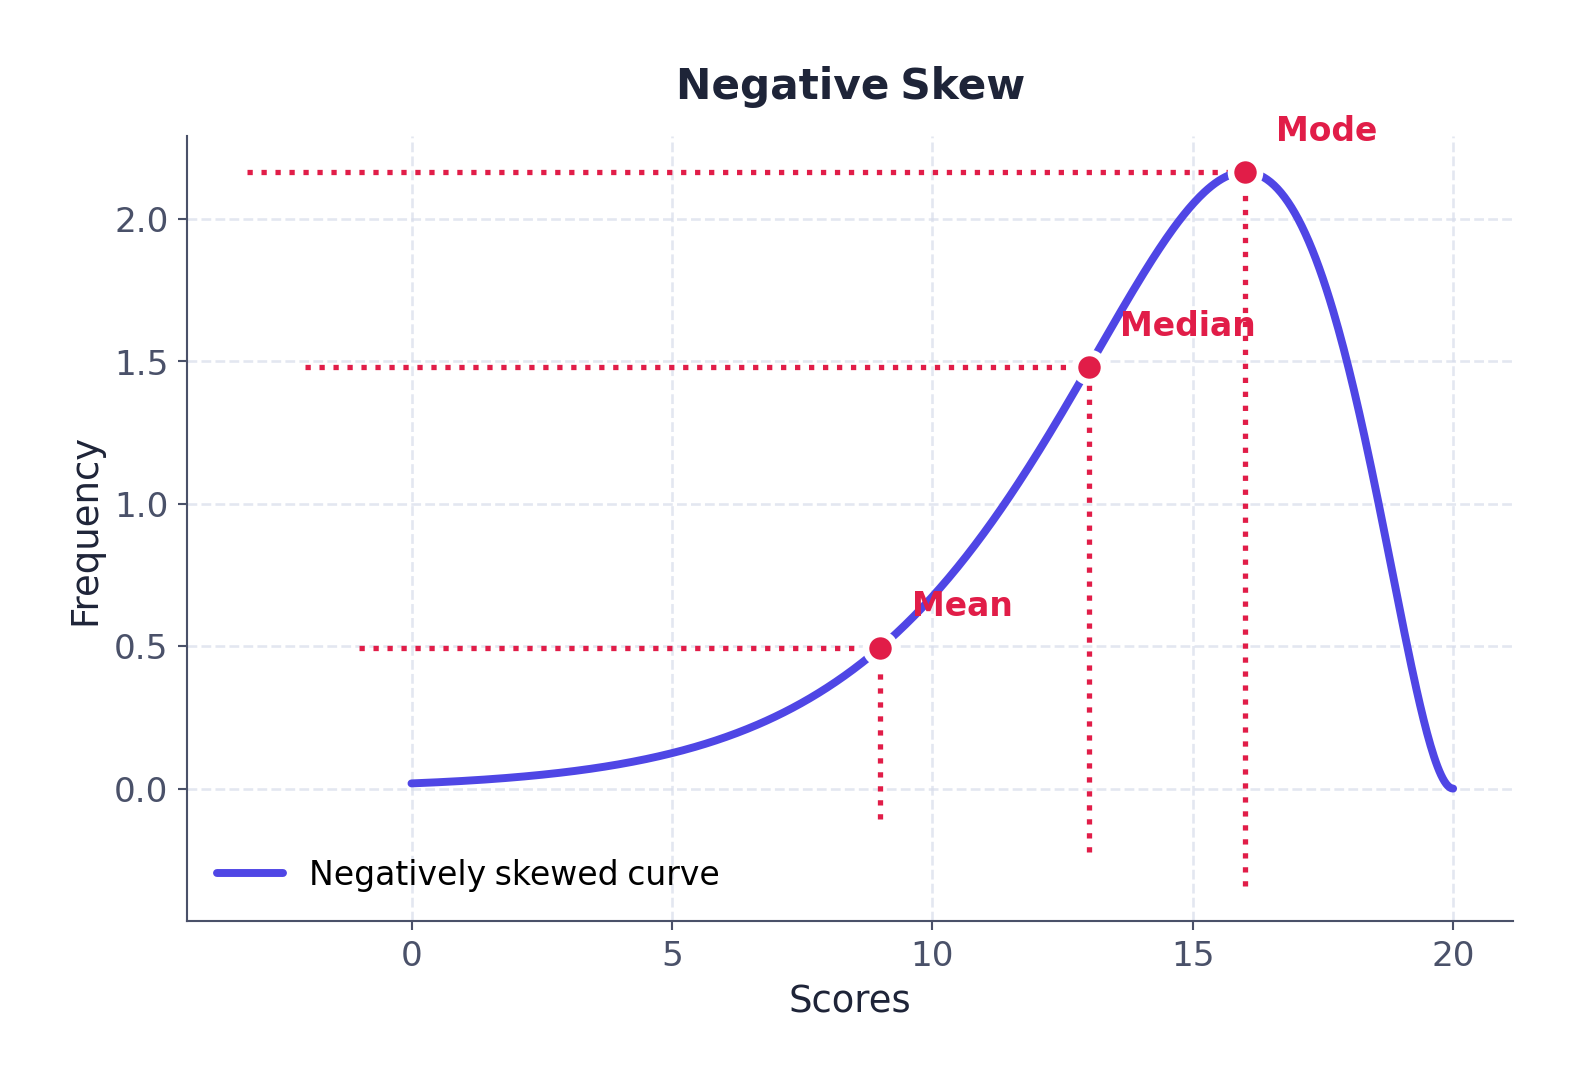
When data is skewed (lopsided) instead of symmetrical, the three measures pull apart from each other, and always in a fixed order.
| Distribution | Order along the axis |
|---|---|
| Normal (symmetrical) | Mean = Median = Mode (all coincide) |
| Positive skew | Mode < Median < Mean |
| Negative skew | Mean < Median < Mode |
Students mix up which measure moves furthest in a skew. Remember: the mean is the one that gets pulled hardest, because it is calculated from every value including the extreme ones in the long tail. The mode barely moves, because it just tracks the peak of the curve.
- Data processing uses three techniques: central tendency, dispersion and relationship: this chapter covers only central tendency
- Mean (ungrouped, direct) or (indirect); for grouped data, replace and with and
- Median = value of the th item (ungrouped); for grouped data
- Mode = the most frequently occurring value; a series can be unimodal, bimodal, trimodal, multimodal, or have no mode at all
- Mean = Median = Mode only in a symmetrical, normal distribution
- Positive skew: Mode < Median < Mean. Negative skew: Mean < Median < Mode
- Can I compute the mean by both the direct and indirect method, for ungrouped and grouped data?
- Can I find the median of a grouped distribution using the formula, step by step?
- Can I identify whether a series is unimodal, bimodal or without mode?
- Can I state and explain the order of mean, median and mode in a positive and a negative skew?
- 1 markDefine the mean.
- 1 markWhat is a measure of central tendency?
- 1 markName the three measures of central tendency.
- 1 markWhat is the symbol used for the median?
- 1 markWhat is meant by “coding” in the indirect method of calculating the mean?
- 1 markWhat are the advantages of using the mode?
- 1 markWhat is an assumed mean?
- 1 markWhen is a distribution called bimodal?
- 2 marksDistinguish between the direct method and the indirect method of calculating the mean.
- 2 marksWhy does the mean come out the same whether it is calculated by the direct or the indirect method?
- 3 marksExplain, with the formula, how the median of grouped data is calculated.
- 2 marksWhat is the difference between a unimodal and a multimodal series?
- 3 marksWhy is the median called a “positional average”?
- 2 marksIn the formula , explain what , and stand for.
- 3 marksExplain why the mean is pulled further than the mode when a distribution is skewed.
- 2 marksWhat is meant by a “trimodal” series? Give an example of your own.
- 5 marksExplain the relative positions of mean, median and mode in a normal distribution and in a skewed distribution, with the help of diagrams.
- 5 marksComment on the applicability of mean, median and mode, on the basis of their merits and demerits.
- 5 marksExplain, with a suitable imaginary example, the direct and indirect methods of calculating the mean from ungrouped data.
- 5 marksDescribe, with an example, how the mean is computed from grouped data using both the direct and the indirect method.
- 3 marksCalculate the mean of the following values by the direct method: 12, 18, 24, 30, 36.
- 3 marksCalculate the median of the following ages (in years): 21, 25, 19, 30, 27, 23.
- 3 marksFind the mode of the following data set: 5, 8, 5, 12, 15, 8, 5, 20.
- 5 marksThe rainfall (in mm) recorded in 5 stations is 620, 580, 705, 640, 655. Find the mean rainfall by the direct method.
- 1 markThe measure of central tendency that does NOT get affected by extreme values is:
(a) Mean(b) Mean and Mode(c) Mode(d) Median - 1 markThe measure of central tendency that always coincides with the hump (peak) of any distribution is:
(a) Median(b) Median and Mode(c) Mean(d) Mode - 1 markIn the indirect method of finding the mean, the constant subtracted from every value is called the:
(a) Median(b) Assumed mean(c) Class interval(d) Cumulative frequency - 1 markA series with three values sharing the highest, equal frequency is called:
(a) Bimodal(b) Unimodal(c) Trimodal(d) Without mode - 1 markThe median of an ungrouped series with observations is the value of the:
(a) th item(b) th item(c) th item(d) th item - 1 markIn a positively skewed distribution, the correct order along the axis is:
(a) Mean < Median < Mode(b) Mode < Median < Mean(c) Median < Mode < Mean(d) Mean = Median = Mode - 1 markIn the formula , the term stands for the:
(a) Frequency(b) Class interval(c) Midpoint of the class(d) Cumulative frequency - 1 markMean, median and mode all coincide at the same point only in a:
(a) Positively skewed distribution(b) Negatively skewed distribution(c) Normal distribution(d) Bimodal distribution
Reason (R): The median depends only on the position of an item in the arranged series, not on its actual value.
Reason (R): In a negative skew, the long tail of the curve points toward the lower values, pulling the mean toward the left of the mode.
Reason (R): When two or more values in a series occur with equal and the highest frequency, the series is called bimodal or multimodal.