
All exercise questions from the NCERT textbook Practical Work in Geography, Part-II, Chapter 2, “Data Processing”, exactly as the English edition prints them, with a full model answer for each. Try your own answer first, then check it against this one.
1 Choose the correct answer from the four alternatives given below
Q. The measure of central tendency that does not get affected by extreme values:
(a) Mean (b) Mean and Mode (c) Mode (d) Median
Answer: (d) Median. The median is a positional average: it depends only on the rank of an item in an arranged series, not on the item’s actual magnitude, so extreme values at either end of the series do not change it. The mean, by contrast, is calculated from every value, including the extremes, so it is the measure most affected by them.
Q. The measure of central tendency always coinciding with the hump of any distribution is:
(a) Median (b) Median and Mode (c) Mean (d) Mode
Answer: (d) Mode. The mode is defined as the value occurring with the maximum frequency, which is exactly the “hump” (the peak of the curve) of any distribution, so the mode always coincides with it, whether the distribution is normal or skewed. The mean and median, on the other hand, shift away from the hump in a skewed distribution.
2 Answer the following questions in about 30 words
Q. Define the mean.
Answer: The mean is the value which is derived by summing all the values of a variable and dividing it by the number of observations. It can be calculated by the direct or the indirect method, for both ungrouped and grouped data.
Q. What are the advantages of using mode?
Answer: The mode is simple to identify from a data set, it is not affected by extreme values (since it only depends on which value repeats the most), and unlike the mean or the median, it can be applied even to qualitative data, such as the most popular colour or the most preferred choice, where an arithmetic average cannot be found at all.
3 Answer the following questions in about 125 words
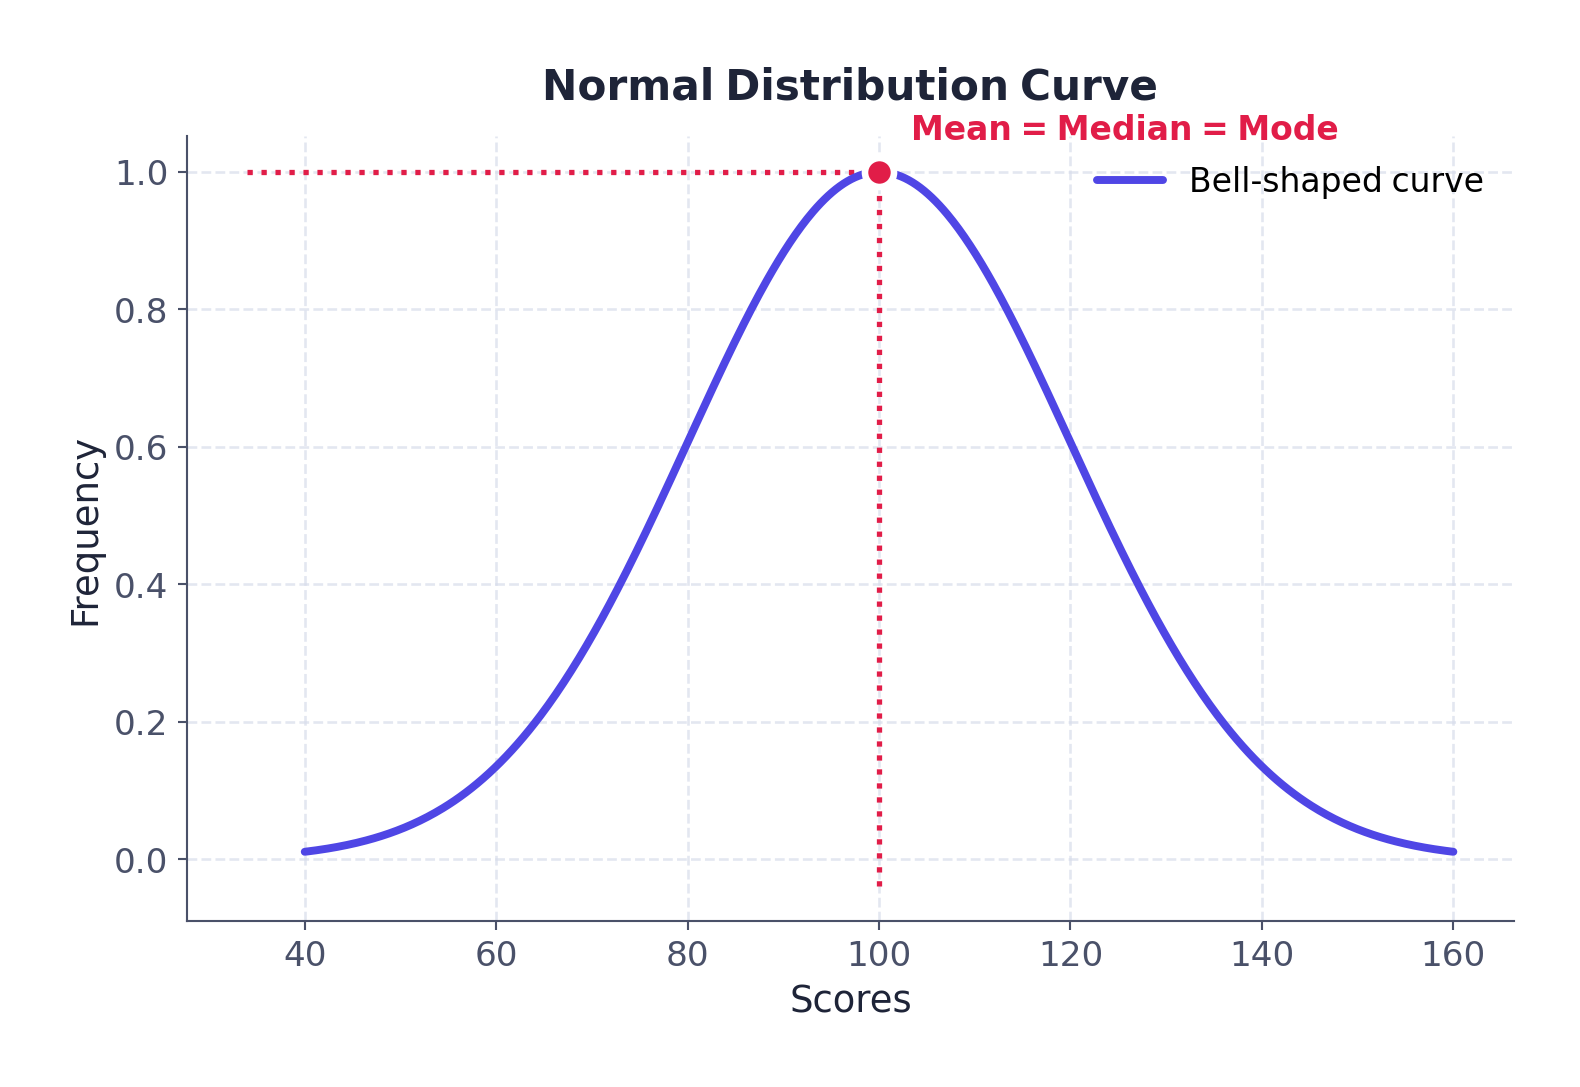
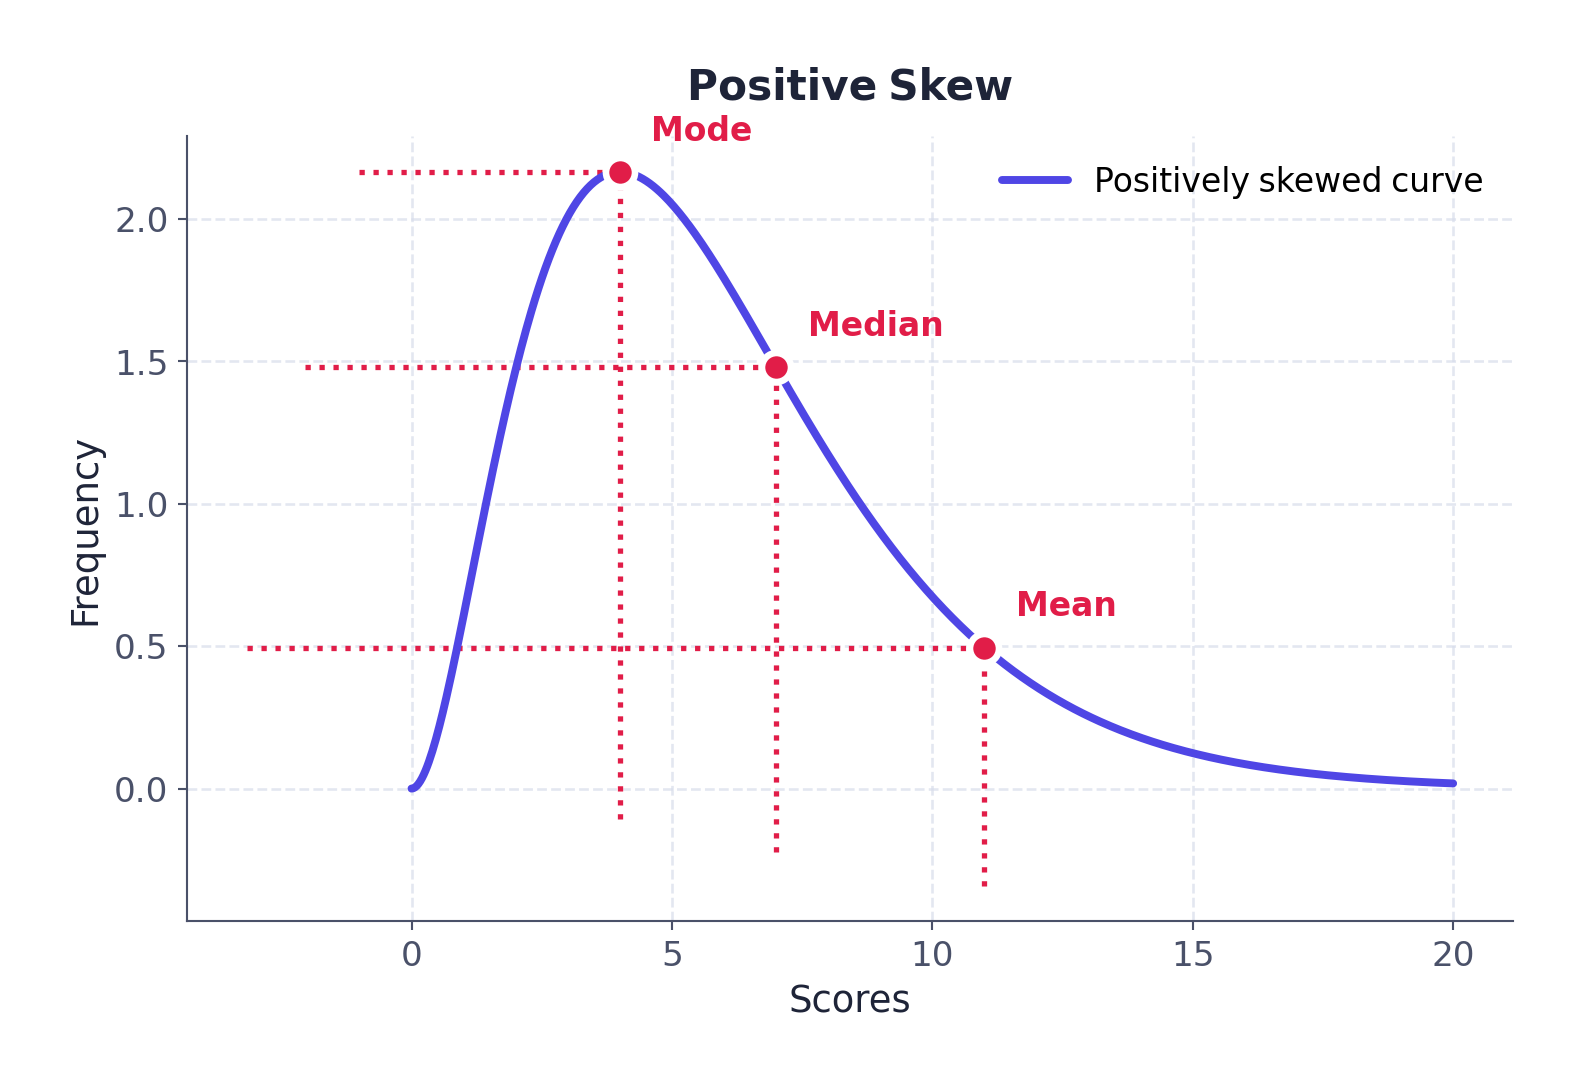
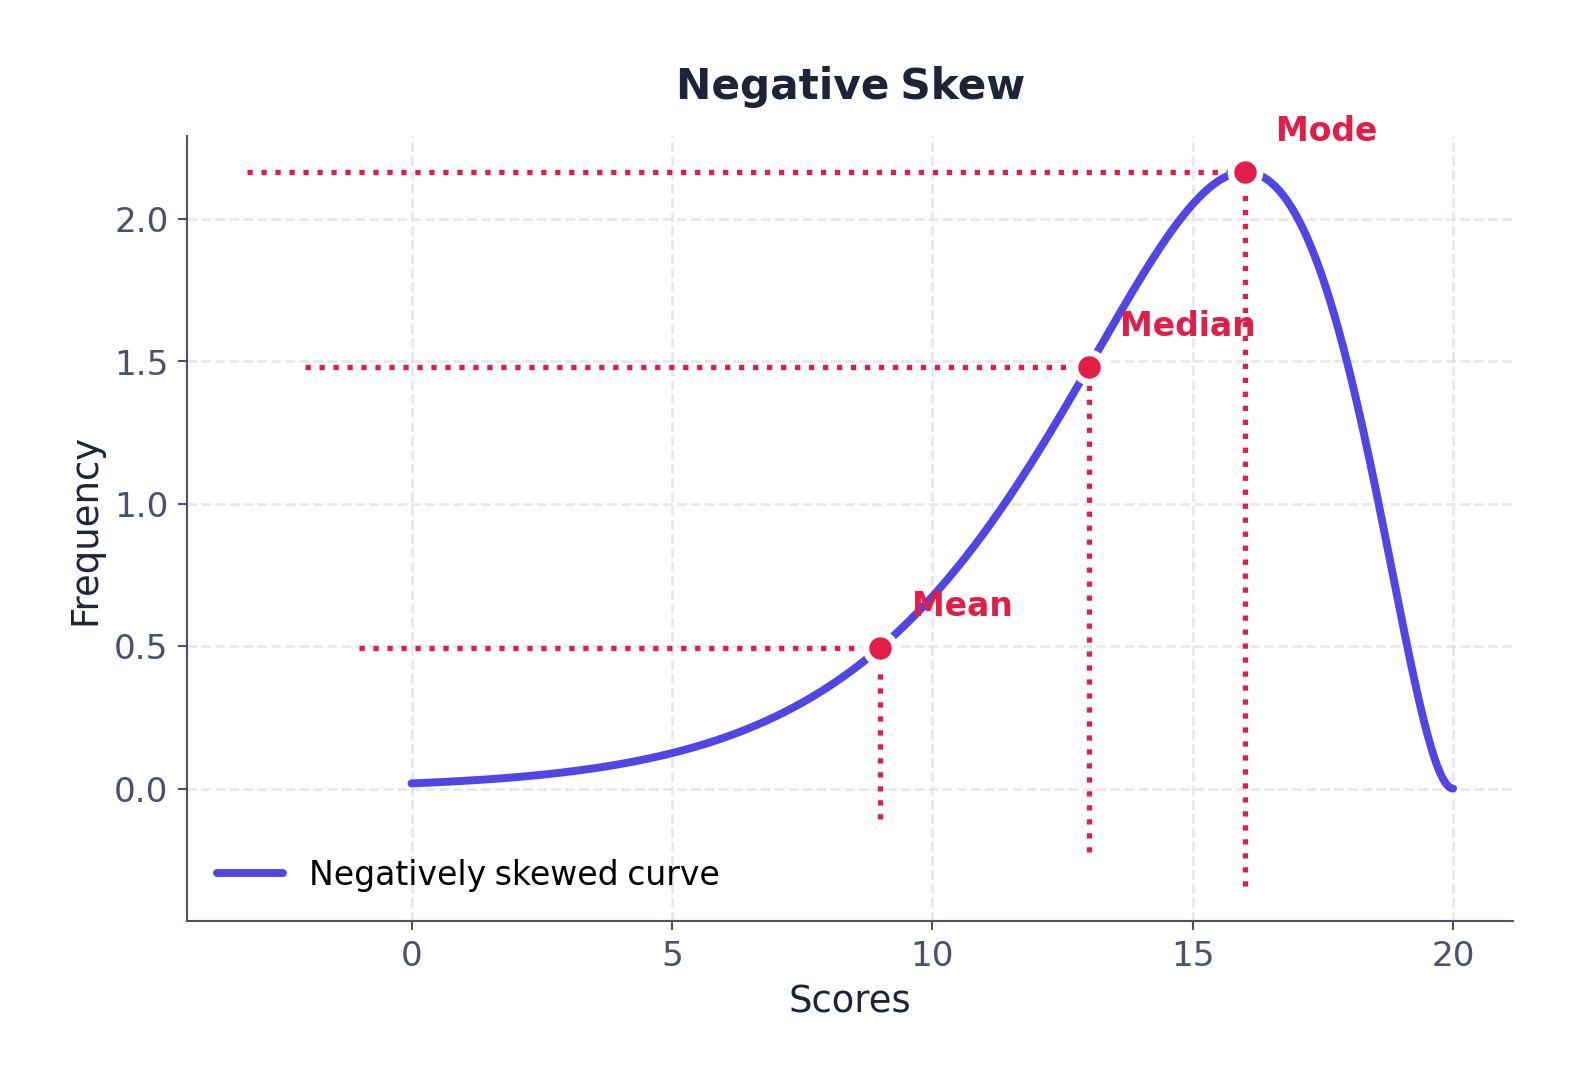
Q. Explain relative positions of mean, median and mode in a normal distribution and skewed distribution with the help of diagrams.
Answer: In a normal distribution, the curve is a perfectly symmetrical, bell-shaped curve (Fig. 2.1). Because it is symmetrical, the mean, the median and the mode are all the same score, coinciding exactly at the centre/peak of the curve; the highest-frequency score occurs in the middle, with exactly half of the observations above it and half below. When the data are skewed (distorted), this equality breaks down and the three measures no longer coincide. In a positive skew (Fig. 2.2), the curve’s long tail lies towards higher values, pulling the mean towards the extreme right; the mode stays nearest to the peak and the median lies between the two, giving the order Mode < Median < Mean. In a negative skew (Fig. 2.3), the long tail lies towards lower values, pulling the mean towards the extreme left, giving the order Mean < Median < Mode. In both skewed cases the mode moves the least (it only follows the peak) and the mean moves the most (its calculation uses every value, extremes included).
Q. Comment on the applicability of mean, median and mode (hint: from their merits and demerits).
Answer: The mean uses every value in the data set and is the measure most widely used for further statistical analysis, but its biggest demerit is that it is heavily distorted by extreme (very large or very small) values. The median is a positional average, so it is unaffected by extreme values and gives a fair representative figure even for a skewed distribution; its demerit is that it ignores the actual magnitude of the observations and uses only their rank/order. The mode is the easiest of the three to find, is unaffected by extreme values, and is the only one of the three that can be applied to qualitative (non-numeric) data; its demerit is that a series can have no mode at all, or more than one mode, which makes it a less stable and less reliable single figure than the mean or the median. In practice, therefore, the choice of measure depends on the nature of the data and the purpose of the analysis: the mean where all values matter and extremes are rare, the median for skewed distributions, and the mode for qualitative or multi-peaked data.
4 Activity
Q. Take an imaginary example applicable to geographical analysis and explain direct and indirect methods of calculating mean from ungrouped data.
Answer: Suppose the population of five villages (in hundreds) is 45, 52, 58, 63, 67. Direct method: add all the raw values and divide by the number of observations: Σx=45+52+58+63+67=285, N=5, so X̄=285/5=57. Indirect method: choose an assumed mean close to the middle of the series, say A=55, and find each value’s deviation from it: d=x−A gives −10, −3, 3, 8, 12, so Σd=10; the mean is then X̄=A+Σd/N=55+10/5=55+2=57. Both methods give the identical mean (57 hundred, that is, 5,700 people), because the indirect method only reduces the values to smaller, easier numbers to work with; it does not change the underlying total or the final answer.