
| Board | This chapter | Paper shape |
|---|---|---|
| CBSE (2026-27 curriculum) | 10 marks (Unit 2) | 80 theory + 20 project |
Other boards that teach this NCERT book set their own marks. Check your
board’s current scheme of examination for this chapter’s weight.
1 What Demography Is, and Why Sociology Needed It
The word is Greek: demos means people, graphein means to describe.
Demography is the description of people.
Demography is the systematic study of population: changes in population
size, patterns of births, deaths and migration, and the structure and composition of
the population, such as the relative proportions of women, men and different age
groups.
1.1 Two kinds of demography
Formal demography
- A largely quantitative field
- Concerned with the measurement and analysis of the components of population change
- Has a highly developed mathematical methodology for forecasting growth and changes in composition
- Asks: how much, how fast?
Social demography, or population studies
- Focuses on the social, economic and political aspects of populations
- Enquires into the wider causes and consequences of population structures and change
- Holds that social processes and structures regulate demographic processes
- Asks: why, and what follows from it?
Both kinds rest on counting, or enumeration. The two methods the chapter names are
the census and the survey.
A census systematically collects data on all the people residing within a
specified territory. In India it is decennial, held every ten years.
1.2 How the census came about
Two things happened together in Europe in the second half of the eighteenth century:
the formation of nation-states as the principal form of political organisation,
and the beginning of the modern science of statistics. The modern state was
expanding into public health management, policing and law and order, economic policies
for agriculture and industry, taxation and revenue, and the governance of cities. All of
that needed social statistics, meaning regular quantitative data on the population
and the economy. The practice is old, but it took its modern form towards the end of the
eighteenth century.
The Indian census is the largest exercise of its kind anywhere in the world. China
has a slightly larger population, but China does not conduct regular censuses.
1.3 Why sociology owed so much to demography
Aggregate statistics are the numerical characteristics that refer to a
collectivity of millions of people, and they offered a concrete argument that social
phenomena exist. A death rate is built by adding up individual deaths, yet the death
rate itself is a social fact and must be explained at the social level.
Emile Durkheim’s study of suicide is the chapter’s example. He explained the
variation in suicide rates across countries, the suicide rate being suicides per
1,00,000 population, and argued that the rate must be explained by social
causes even though each individual case had reasons specific to that person. In the
same way, the death rate itself is a social phenomenon and must be explained at the
social level.
Demographic data are also essential for planning and implementing state policies,
especially those for economic development and public welfare.
2 Two Theories You Must Know
2.1 The Malthusian theory of population growth
Thomas Robert Malthus (1766-1834), an English political economist, set out his
pessimistic theory in his Essay on Population, 1798. Human populations, he
argued, grow much faster than the means of subsistence: food especially, but also
clothing and other agriculture-based products.
Because population growth always outstrips subsistence resources, humanity is
condemned to live in poverty forever, and the only way to increase prosperity is to
control population growth. Malthus saw two kinds of check.
Preventive checks
- Deliberate and voluntary
- Postponing marriage, sexual abstinence, celibacy
- Humanity has only a limited ability to use them
Positive checks
- Famines and diseases
- Malthus believed these were inevitable
- They were nature’s way of dealing with the imbalance between food supply and an increasing population
A “positive” check is not a good thing. Malthus called famines and diseases
‘positive checks’ and saw them as nature’s way of dealing with the imbalance
between food supply and increasing population; preventive checks are the
voluntary ones, such as postponing marriage.
The power of population is so superior to the power of the earth to produce
subsistence for man, that premature death must in some shape or other visit the human
race. The vices of mankind are active and able ministers of depopulation. …
Malthus, An Essay on the Principle of Population, 1798 (Box 2.1 of the textbook)
Malthus studied at Cambridge and trained to become a Christian priest, and was later
Professor of History and Political Economy at the East India Company College at
Haileybury near London, the training centre for Indian Civil Service officers.
2.2 Why Malthus was proved wrong
The historical refutation
Some theorists claimed economic growth could outstrip population growth, but the
most effective refutation was the historical experience of European
countries. The pattern changed in the latter half of the nineteenth century, and
dramatically by the end of the first quarter of the twentieth: birth rates
declined and epidemics were controlled. His predictions failed because
both food production and standards of living continued to rise despite rapid
population growth.
The liberal and Marxist criticism
Liberal and Marxist scholars attacked his claim that poverty was caused by
population growth. Poverty and starvation, they argued, come from the unequal
distribution of economic resources: an unjust social system let a wealthy
privileged minority live in luxury while the vast majority lived in poverty.
2.3 The theory of demographic transition
This theory links population growth to overall levels of economic development,
and holds that every society follows a typical pattern. There are three basic
stages.
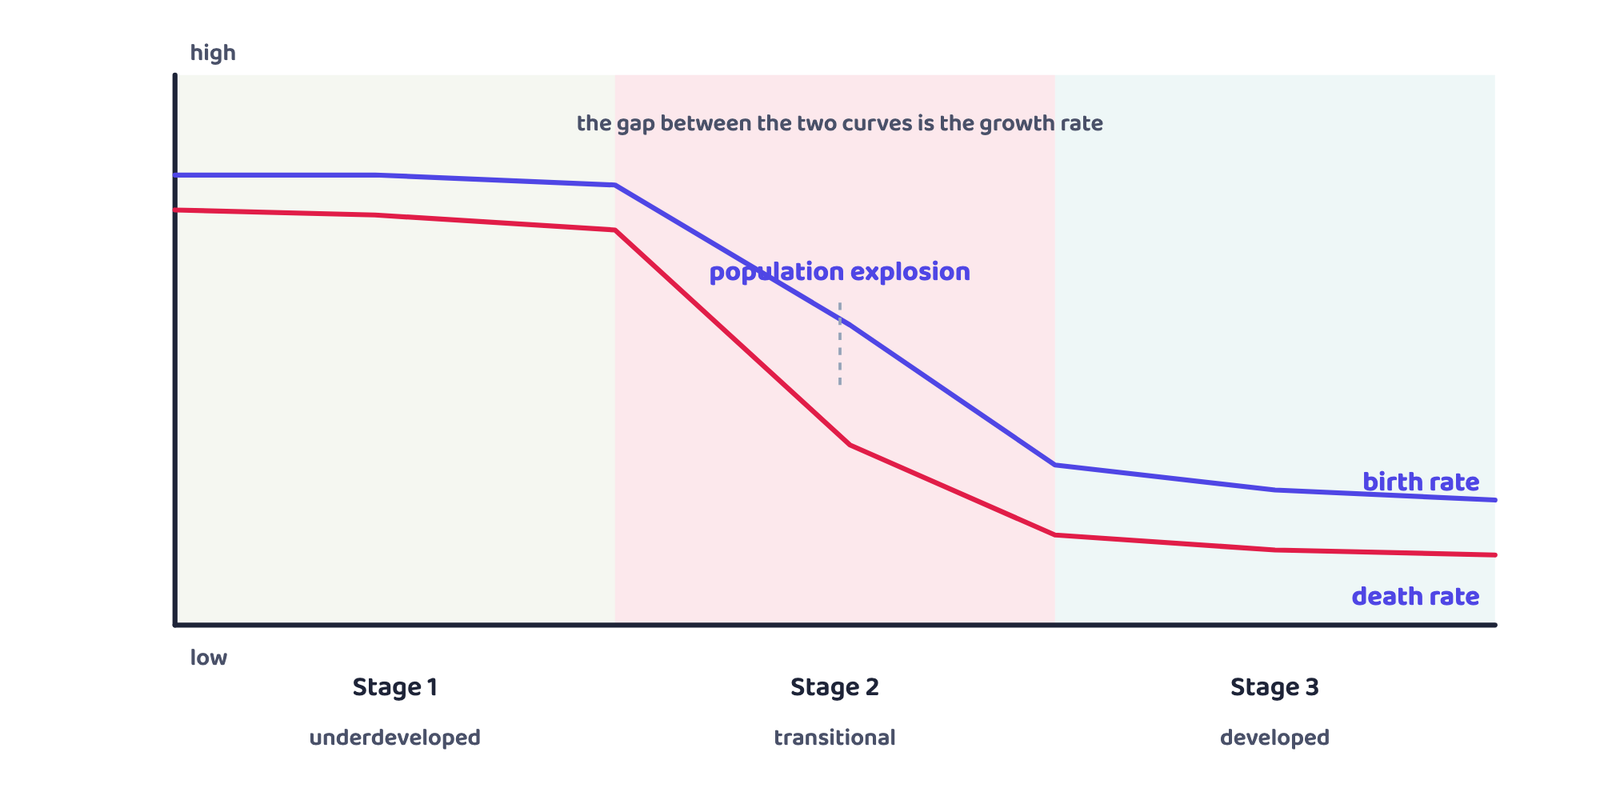
low at both ends and explosive in the middle, because the death rate falls long before
the birth rate.
Low growth
An underdeveloped and technologically backward society. Growth is low
because both the death rate and the birth rate are very high, so the
difference between them, the net growth rate, is low.
Very high growth
The transitional stage, the movement from a backward to an advanced stage,
characterised by very high rates of population growth. This is the population
explosion.
Low growth again
A developed society in which both rates have been reduced
considerably and the difference between them is once again small.
The middle stage explodes because the two rates do not fall together.
This transition was effected in Western Europe during the late nineteenth and
early twentieth century, and similar patterns follow in less developed countries
struggling to reduce the birth rate in keeping with a falling mortality rate. In India
the transition is not yet complete: the mortality rate has been reduced, but the birth
rate has not been brought down to the same extent.
Exercise question 1 asks for the basic argument and why the transition
period brings a population explosion. Answer both halves: many students explain the
three stages beautifully and never say why the middle one explodes.
3 Common Concepts and Indicators
3.1 Rates, ratios and what they are counted against
Most demographic concepts are rates or ratios, so they involve two numbers:
the statistic for a geographical-administrative unit, and a standard for comparison so
that a large country and a small district can be compared fairly. That is why almost
everything here is “per 1000” or “per 1,00,000”.
The birth rate is the total live births in an area during a specified
period, usually a year, divided by that area’s total population in thousands: in
short, live births per 1000 population.
The death rate is the number of deaths in a given area during a given time
per 1000 population.
The rate of natural increase, also called the growth rate of
population, is the difference between the birth rate and the death rate.
The replacement level is reached when that difference is zero, or in
practice very small, so the population has stabilised: the rate of growth
required for new generations to replace the older ones dying out.
Some societies go further into a negative growth rate, with fertility below
the replacement rate. The chapter names Japan, Russia, Italy and Eastern Europe.
The fertility rate is the number of live births per 1000 women in the
child-bearing age group, usually taken to be 15 to 49 years.
Birth, death and fertility rates are all crude rates: a rough average for a
whole population that takes no account of differences across age groups. Those
differences matter, so demographers also calculate age-specific rates.
3.2 The mortality and life indicators
The infant mortality rate is the number of deaths of babies before the
age of one year, per 1000 live births.
The maternal mortality rate is the number of women who die in childbirth
per 1,00,000 live births.
High infant and maternal mortality is an unambiguous indicator of backwardness and
poverty. Development brings sharp falls in both as medical facilities, education,
awareness and prosperity increase.
Life expectancy is the estimated number of years an average person is
expected to survive, calculated from age-specific death rates in a given area over a
period of time.
3.3 Sex ratio, age structure and dependency
The sex ratio is the number of females per 1000 males in a given area
at a specified time period.
Historically most countries have slightly more females than males, which is
surprising: nature produces roughly 943 to 952 female babies for every 1000
males. Two things tip the balance back.
✓ Why females still outnumber males
- Girl babies have an advantage in resistance to disease in infancy
- Women tend to outlive men in most societies, so there are more older women than men
- Together these give roughly 1050 females per 1000 males in most contexts
✗ Where that does not hold
- The sex ratio is declining in China, South Korea and specially India
- Linked to social norms that value males much more than females
- Which leads to “son preference” and the relative neglect of girl babies
The age structure of the population is the proportion of persons in
different age groups relative to the total population.
It changes with levels of development and average life expectancy. Poor medical
facilities, disease and high infant and maternal mortality make for a short life span at
first; with development, life expectancy improves, so smaller proportions sit in the
younger age groups and larger proportions in the older ones. This is the ageing of the
population.
The dependency ratio compares the dependants, elderly people too old
to work and children too young to work, with the working age group, generally 15 to
64 years. It equals the population below 15 or above 64 divided by the population
aged 15 to 64, usually expressed as a percentage.
Rising ratio
- A cause for worry where the population is ageing
- A smaller proportion of working-age people must provide for a larger proportion of dependants
Falling ratio
- A source of economic growth and prosperity
- Because there are more workers relative to non-workers: the demographic dividend
The demographic dividend is the benefit flowing from the changing age
structure, when a falling dependency ratio gives a society a larger proportion of
workers relative to non-workers. It is temporary: the large pool of working-age
people eventually turns into non-working old people.
4 Size and Growth of India’s Population
India is the second most populous country in the world after China, with
121 crores, or 1.21 billion, in the Census of India 2011. Growth was not always
high: between 1901 and 1951 the average annual rate did not exceed 1.33%,
and in 1911-1921 it was negative, -0.03%, because of the 1918-19 influenza
epidemic. After independence it rose to 2.2% during 1961-1981, and although it has
fallen since it remains one of the highest in the developing world.
| Year | Total population (millions) | Average annual growth rate (%) | Decadal growth rate (%) |
|---|---|---|---|
| 1901 | 238 | – | – |
| 1911 | 252 | 0.56 | 5.8 |
| 1921 | 251 | -0.03 | -0.3 |
| 1931 | 279 | 1.04 | 11.0 |
| 1941 | 319 | 1.33 | 14.2 |
| 1951 | 361 | 1.25 | 13.3 |
| 1961 | 439 | 1.96 | 21.6 |
| 1971 | 548 | 2.22 | 24.8 |
| 1981 | 683 | 2.20 | 24.7 |
| 1991 | 846 | 2.14 | 23.9 |
| 2001 | 1028 | 1.95 | 21.5 |
| 2011 | 1210 | 1.63 | 17.7 |
Table 1 of the textbook: the population of India and its growth during the twentieth century.
4.1 1921 to 1931: the two rates begin to diverge
Chart 1 of the textbook plots the crude birth rate and the crude death rate together
from 1901 to 2017. They begin to diverge after the decade of 1921 to 1931. Before
1931 both were high; after that transitional moment the death rate fell sharply but
the birth rate only fell slightly.
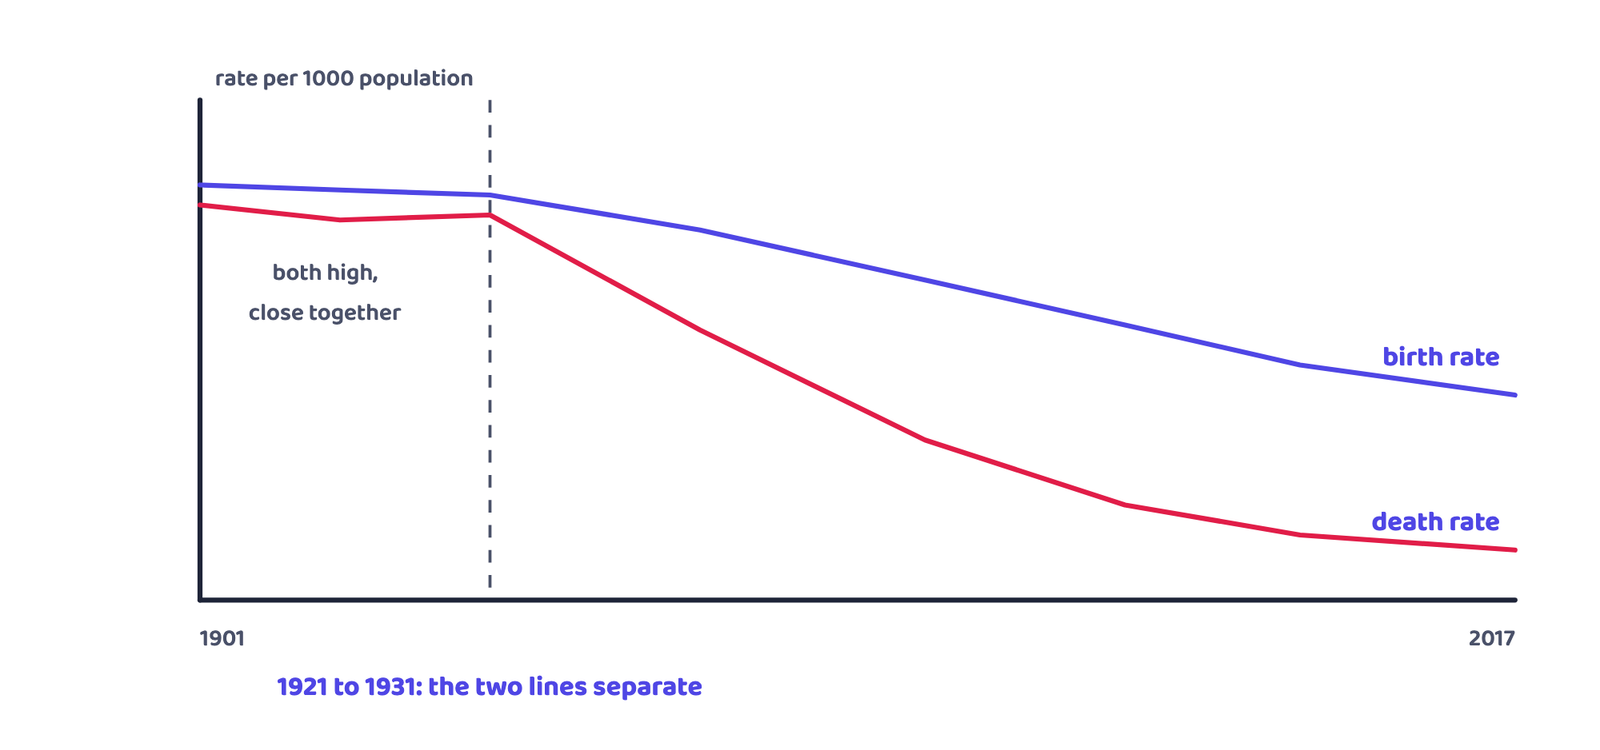
travel together until the 1921 to 1931 decade, then the death rate drops away
steeply.
4.2 Why the death rate fell
The principal reasons were increased control over famines and epidemic
diseases, of which epidemic control was perhaps the more important.
Epidemics brought under control
The major epidemic diseases of the past were fevers of various sorts, plague,
smallpox and cholera. What brought them down was improvements in medical
cures, mass vaccination and better sanitation. Malaria,
tuberculosis, diarrhoea and dysentery still kill, but nowhere near the old
numbers. Surat saw a small plague epidemic in September 1994, and dengue and
chikungunya have since been reported in various parts of the country.
Famines brought under control
Famines came from continuing poverty and malnutrition in an
agroclimatic environment very vulnerable to variations in rainfall, worsened by
inadequate transport and communication and inadequate efforts by the
state. Deaths fell with improvements in agricultural productivity, especially
the expansion of irrigation, better communication, and more vigorous relief and
preventive measures by the state.
As scholars like Amartya Sen have shown, famines were not necessarily due
to a fall in foodgrains production. They were also caused by a “failure of
entitlements”, the inability of people to buy or otherwise obtain food. Starvation deaths are still reported
from some backward regions, and the Mahatma Gandhi National Rural Employment
Guarantee Act is the latest state initiative against hunger in rural areas.
India’s single biggest epidemic, and the reason the 1921 census recorded fewer
people than 1911. The chapter puts India’s toll at about 12.5 million, roughly 5% of
the total population (Visaria and Visaria 2003), gives 170 lakh elsewhere,
and says openly that estimates vary and some are much higher. Also called
“Spanish Flu”, it was a pandemic, an epidemic affecting a very wide
geographical area, and worldwide it is thought to have killed at least 40 million.
Box 2.2 adds that two more influenza pandemics followed, in 1957 (“Asian
influenza”) and 1968 (“Hong Kong influenza”); that an estimated 17 million
died in India, about 5% of its population; and that World War I did not cause the flu,
but the close quarters and mass movement of troops quickened its spread.
4.3 Why the birth rate has not fallen sharply
The birth rate has not registered a sharp fall, because it is a sociocultural
phenomenon that is relatively slow to change.
By and large, increased levels of prosperity exert a strong downward pull on it:
once infant mortality rates decline and there is an overall increase in the levels of
education and awareness, family size begins to fall.
4.4 Fertility varies enormously across the States
| Group | States | Total fertility rate (2016) |
|---|---|---|
| Below the replacement level | Andhra Pradesh, Himachal Pradesh, Punjab, Tamil Nadu, West Bengal | 1.7 each |
| Also below the replacement level | Kerala | below replacement, so its population is going to decline in future |
| Still very high | Bihar | 3.3 |
| Still very high | Uttar Pradesh | 3.1 |
| Still very high | Madhya Pradesh | 2.8 |
| Still very high | Rajasthan | 2.7 |
A total fertility rate of 1.7 means the average woman in those states produces only 1.7 children, which is below the replacement level.
The Sample Registration System, Statistical Report 2020 puts India’s crude
birth rate at 19.5, rural 21.1, urban 16.1, with Bihar 25.5
and Uttar Pradesh 25.1 the highest in India. The Economic Survey 2018-19
projects that these two states will account for almost half, 50%, of India’s
population additions up to 2041, Uttar Pradesh alone a little under
one-quarter, 22%.
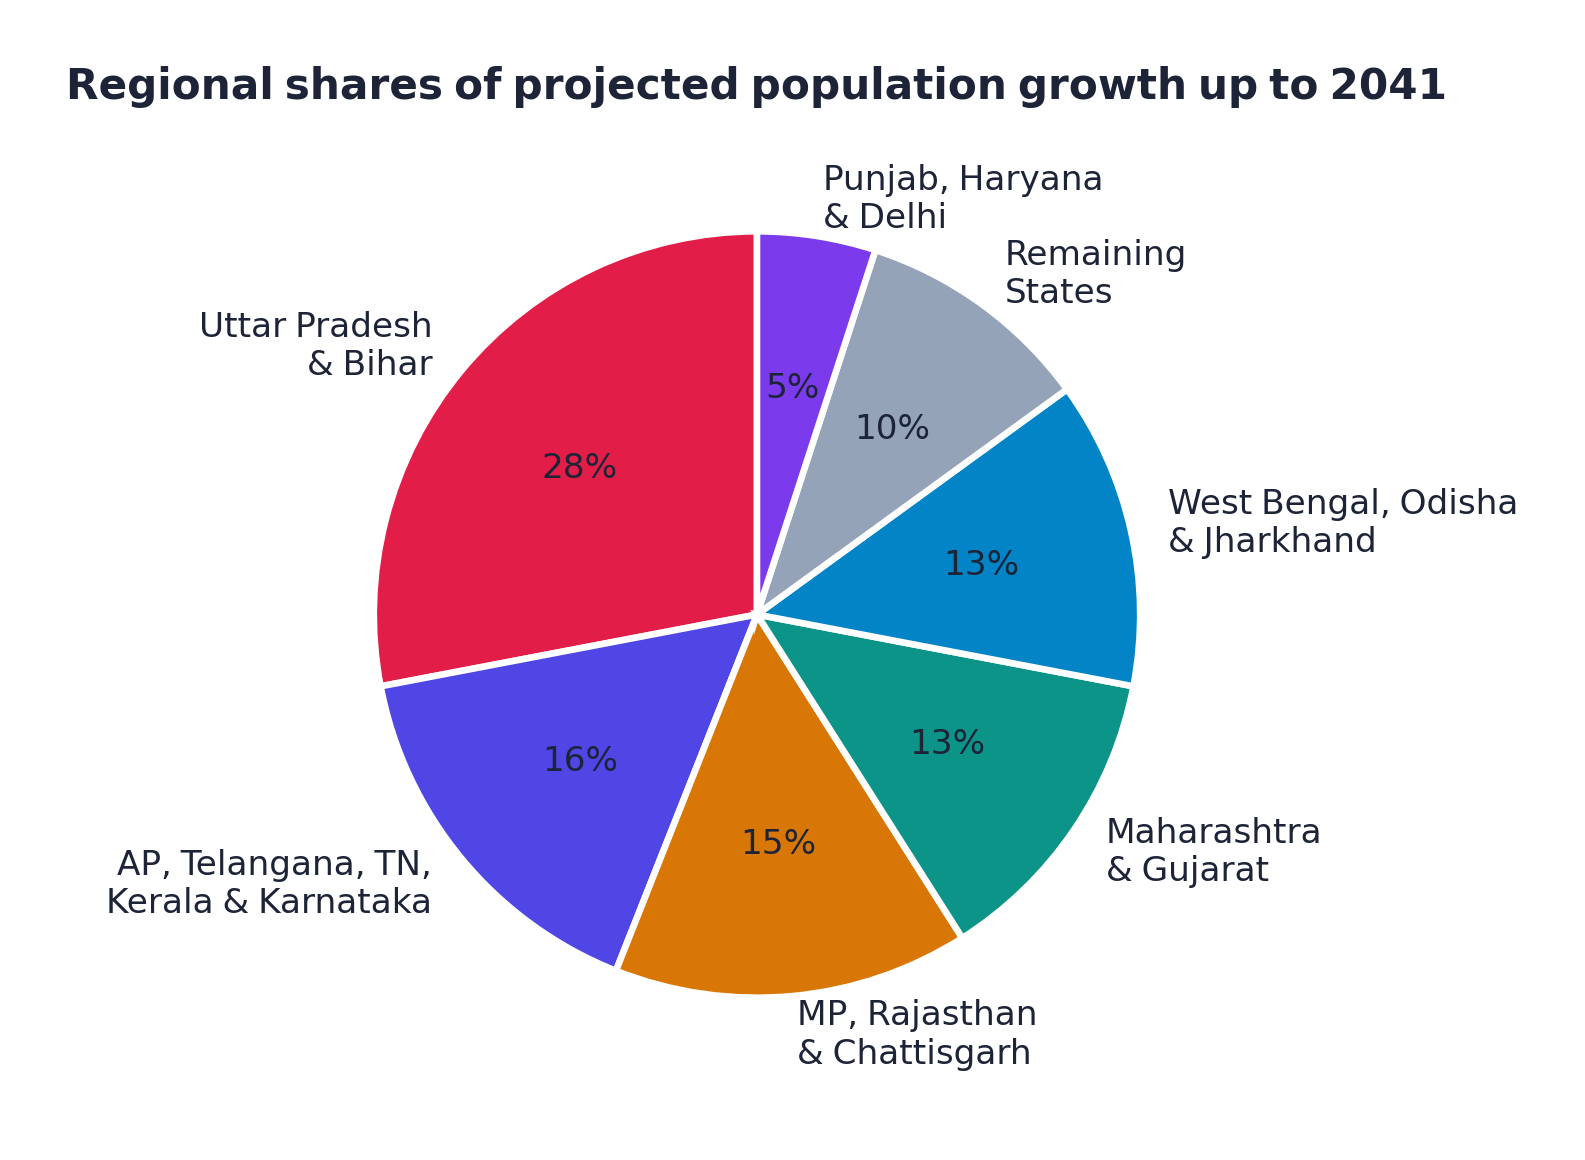
to 2041. Uttar Pradesh and Bihar together account for more than a quarter.
| Regional group of States (Chart 2, Economic Survey 2018-19) | Share of projected growth to 2041 |
|---|---|
| Uttar Pradesh and Bihar | 28% |
| Andhra Pradesh, Telangana, Tamil Nadu, Kerala and Karnataka | 16% |
| Madhya Pradesh, Rajasthan and Chattisgarh | 15% |
| Maharashtra and Gujarat | 13% |
| West Bengal, Odisha and Jharkhand | 13% |
| Remaining States | 10% |
| Punjab, Haryana and Delhi | 5% |
Exercise question 4 asks for the replacement-level states, the high-growth states
and the reasons for the regional differences. The third part is your own
reasoning, and the chapter hands you the material: prosperity, falling infant mortality,
education and awareness pull a birth rate down. The chapter gives no state-by-state
history, so present any state-specific explanation as your own opinion.
5 Age Structure and the Demographic Dividend
India has a very young population: most Indians tend to be young, and the
average age is less than for most other countries.
| Year | 0-14 years (%) | 15-59 years (%) | 60+ years (%) | Total |
|---|---|---|---|---|
| 1961 | 41 | 53 | 6 | 100 |
| 1971 | 42 | 53 | 5 | 100 |
| 1981 | 40 | 54 | 6 | 100 |
| 1991 | 38 | 56 | 7 | 100 |
| 2001 | 34 | 59 | 7 | 100 |
| 2011 | 29 | 63 | 8 | 100 |
| 2026 (projected) | 23 | 64 | 12 | 100 |
Table 2 of the textbook. Rows may not add up to 100 because of rounding.

projection.
Read the three movements off the table. The under-15 share came down from its
highest level of 42% in 1971 to 29% in 2011; the 15-59 share rose from 53% to
63%; the 60+ share is very small but has begun to increase, from 5% in 1971 to 8% in 2011.
Most of the change over the next two decades is again at the two ends: the
0-14 group loses about 11% of its share (34% in 2001 to 23% in 2026) and the
60+ group gains about 5% (7% to about 12%).
5.1 How to read a population pyramid
Chart 3 shows four pyramids: 1961, 1981, 2001 and the 2026 estimates. A pyramid is
a more detailed version of what Table 2 gives, and reading one is a real exam skill.
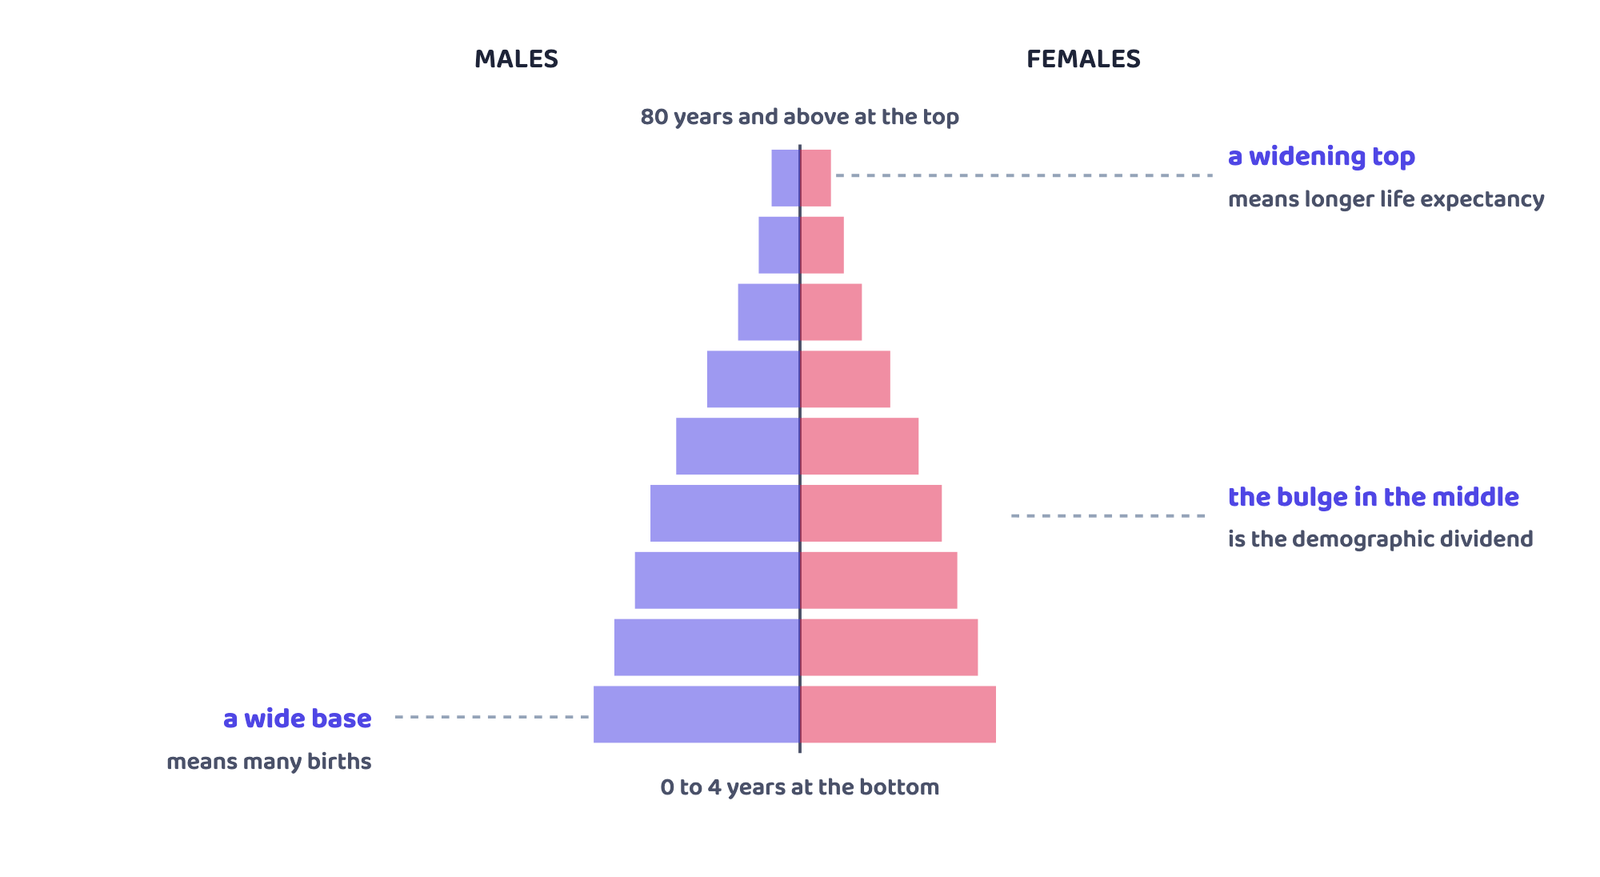
right, five-year age groups from 0 to 4 at the bottom to 80 and above at the
top.
The pyramids show a gradual fall in the birth rate and a rise in life
expectancy. As more people live to an older age the top grows wider; as fewer
births take place the bottom grows narrower, but the birth rate is slow to fall,
so the bottom does not change much between 1961 and 1981. The middle grows
wider and wider, creating a “bulge” clearly visible in the 2026 pyramid: that
bulge is the demographic dividend. The 2026 figures are projections, estimates
based on past rates of growth.
The book asks you to trace the new-born generation of 1961 (the 0-4 age group) up
the pyramids for the later years, to find the widest part of each pyramid from 1961 to
2026, and to guess the shape in 2051 and 3001. Model answers to this exercise and to
Activities 2.1 to 2.4 are in the NCERT Solutions for this chapter.
5.2 Kerala and Uttar Pradesh, two Indias
Chart 4 sets the estimated 2026 pyramids for Uttar Pradesh and Kerala side by side,
and the difference in where each is widest is the whole point.
Kerala
- Beginning to acquire an age structure like that of the developed countries
- Fewer children, more people in the older age groups
- Total fertility rate already below the replacement level
Uttar Pradesh
- A very different picture
- High proportions in the younger age groups, relatively low proportions among the aged
- Total fertility rate 3.1 in 2016, among the highest in the country
India as a whole is somewhere in the middle, containing states like Uttar
Pradesh as well as states more like Kerala.
5.3 The demographic dividend, and why it is not automatic
The bias towards younger age groups is believed to be an advantage. Like the East
Asian economies in the past decade and like Ireland today, India is supposed
to be benefiting from a demographic dividend: the current generation of working-age
people is large, and it has only a small preceding generation of old people to
support.
There is nothing automatic about this advantage. It needs to be consciously
exploited through appropriate policies.
the sentence to open any answer on the demographic dividend
A third of India’s population was below 15 in 2011, and India will remain one of the
world’s youngest countries for some time, implying a large and growing labour force. But
the potential converts into growth only if the rise in the working age group is
accompanied by increasing levels of education and employment: new entrants who are
not educated have low productivity, and those who remain unemployed become
dependants rather than earners.
“The real problem is in defining the dependency ratio as the ratio of the
non-working age to working-age population, rather than the ratio of non-workers to
workers. The difference between the two is determined by the extent of
unemployment and underemployment, which keep a part of the labour force out of
productive work. This difference explains why some countries are able to exploit the
demographic advantage while others are not.”
India is facing a window of opportunity. The total dependency ratio fell
from 79 in 1970 to 64 in 2005. The age-based dependency ratio is projected to
fall to 48 in 2025 as the proportion of children continues to fall, and then to
rise to 50 by 2050 as the proportion of the aged increases.
1970 and 2005: total dependency ratio. 2025 and 2050: the age-based dependency ratio, projected. The window closes when the line turns back up.
The problem is employment. Government of India data reveal a sharp fall in the
rate of employment generation, the creation of new jobs, across both rural and urban
areas, and this is true for the young too. Growth of employment in the 15-30 age
group stood at around 2.4 per cent a year between 1987 and 1994 for rural and
urban men alike, and fell to 0.7 for rural men and 0.3 per cent for urban men during
1994 to 2004. The advantage of a young labour force is not being exploited,
and India’s recent experience suggests that market forces by themselves do not ensure
that such strategies would be implemented.
The employment passage beside Activity 2.3 in the textbook is adapted
from an article by C.P. Chandrashekhar in Frontline, Volume 23, Issue 01,
January 14-27, 2006.
6 The Declining Sex Ratio in India
The sex ratio is an important indicator of gender balance. Historically it
has favoured females slightly, but India has had a declining sex ratio for more than a
century.
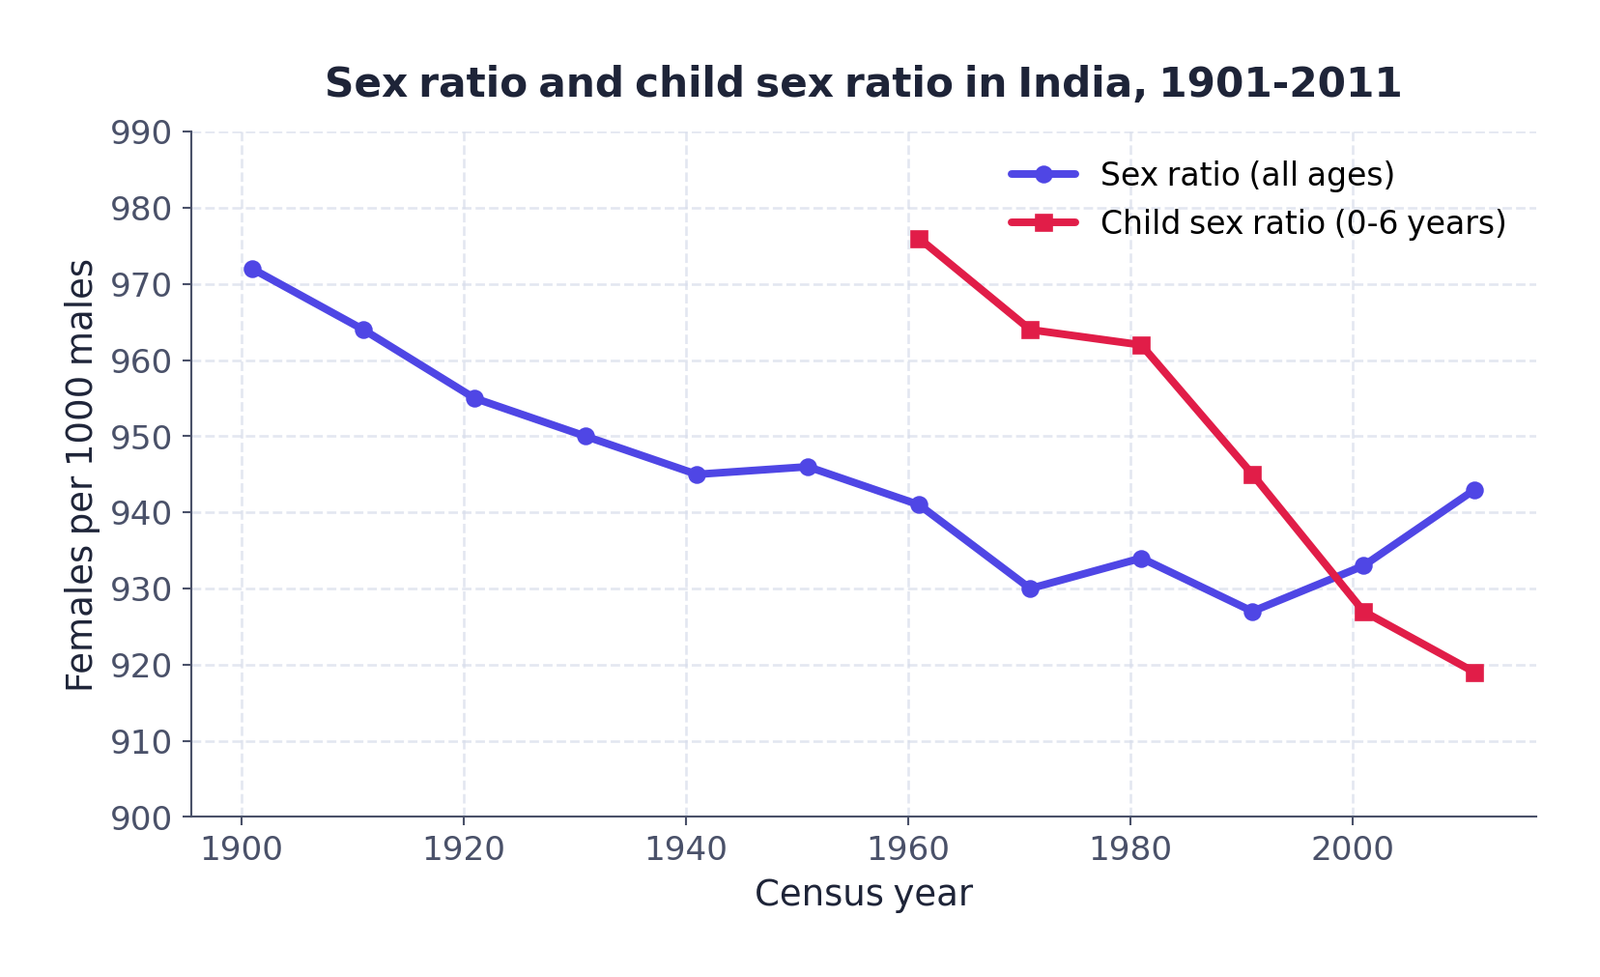
overall ratio has recovered since 1991, while the child sex ratio fell steeply and
crossed below it in 2001.
| Year | Sex ratio (all age groups) | Variation over previous decade | Child sex ratio (0-6 years) | Variation over previous decade |
|---|---|---|---|---|
| 1901 | 972 | – | – | – |
| 1911 | 964 | -8 | – | – |
| 1921 | 955 | -9 | – | – |
| 1931 | 950 | -5 | – | – |
| 1941 | 945 | -5 | – | – |
| 1951 | 946 | +1 | – | – |
| 1961 | 941 | -5 | 976 | – |
| 1971 | 930 | -11 | 964 | -12 |
| 1981 | 934 | +4 | 962 | -2 |
| 1991 | 927 | -7 | 945 | -17 |
| 2001 | 933 | +6 | 927 | -18 |
| 2011 | 943 | +10 | 919 | -8 |
Table 3 of the textbook. Data on age-specific sex ratios is not available before 1961, which is why the last two columns start there.
From 972 at the turn of the twentieth century it declined to 933 at the
turn of the twenty-first: from 941 in 1961 to an all-time low of 927 in
1991, a modest rise in 2001, and 943 in the Census of India 2011.
The child sex ratio, or juvenile sex ratio, is the sex ratio for the
0 to 6 years age group. Age-specific sex ratios have been computed since
1961.
6.1 The anomaly of 1991 to 2001
What has alarmed demographers, policy makers, social activists and concerned citizens
is the drastic fall in the child sex ratio, normally well above the overall ratio.
In the 2011 Census it fell again, by 8 points (927 to 919, Table 3), to 919.
6.2 The state pattern
As many as nine States and Union Territories are under 900. The chapter names
seven of them in the row below.
| Band (child sex ratio, 0-6 years, 2011) | States and Union Territories |
|---|---|
| Below 800, the worst in the country | Haryana, 793, the only state below 800 |
| Under 900, following Haryana | Punjab, Jammu & Kashmir, Delhi, Chandigarh, Uttarakhand, Himachal Pradesh |
| Under 925 | Uttar Pradesh, Daman & Diu, Himachal Pradesh, Lakshadweep, Madhya Pradesh |
| Above the national average of 919 but below 970 | West Bengal, Assam, Bihar, Tamil Nadu, Andhra Pradesh, Karnataka |
| Better, but still not good | Kerala, 964, despite having the better overall sex ratio |
| The highest in the country | Arunachal Pradesh, 972 |
6.3 Why the sex ratio is falling
The main health factor affecting women differently from men is childbearing,
so it is fair to ask whether the falling sex ratio is partly due to the risk of death in
childbirth. But maternal mortality is supposed to decline with development, as
nutrition, education, awareness and medical facilities improve, and it has indeed been
coming down in India, though it remains high by international standards. So it is
difficult to see how maternal mortality could have been responsible for the worsening of
the sex ratio over time.
Since the decline in the child sex ratio has been much steeper, social
scientists believe the cause has to be sought in the differential treatment of girl
babies. Several factors may be held responsible, including the three below, and there
is some evidence that all of these have been at work in India.
Severe neglect of girl babies
Neglect in infancy, leading to higher death rates among girl children.
Sex-specific abortions
Abortions that prevent girl babies from being born at all.
Female infanticide
The killing of girl babies due to religious or cultural beliefs. Practices
of female infanticide have been known to exist in many regions.
The sonogram is an x-ray-like diagnostic device based on ultra-sound
technology, originally developed to identify genetic or other disorders in the
foetus. It is misused to identify and selectively abort female foetuses, and
increasing importance is being attached to such techniques, which can determine the sex
of the baby very early in pregnancy.
6.4 The prosperity paradox
According to the Economic Survey for a recent year, Maharashtra, Punjab, Haryana,
Chandigarh and Delhi are having high per capita income and the child sex ratio of these
states is still low. So the problem of selective abortions is not due to poverty or
ignorance or lack of resources.
the chapter’s own conclusion, and the answer to “is poverty the cause?”
The chapter’s point is that poverty is not the cause. Sometimes economically
prosperous families decide to have fewer children, often only one or two, and they
may also wish to choose the sex of their child, which ultra-sound technology makes
possible.
6.5 What has been done about it
The chapter does not overstate what a law can do: in the long run the solution
to problems like bias against girl children depends more on how social attitudes
evolve, even though laws and rules help.
7 Literacy
Literacy, as a prerequisite to education, is an instrument of empowerment. The
more literate the population, the greater the consciousness of career options and the
participation in the knowledge economy; literacy also brings health awareness and fuller
participation in the cultural and economic well-being of the community. Literacy has
improved considerably after independence, and almost two-thirds of our population is
now literate (73.0% of those aged 7 and above in 2011, Table 4), but improvements have to struggle to keep up with a rate of population
growth that is still quite high.
| Year | Persons (%) | Males (%) | Females (%) | Male-female gap |
|---|---|---|---|---|
| 1951 | 18.3 | 27.2 | 8.9 | 18.3 |
| 1961 | 28.3 | 40.4 | 15.4 | 25.1 |
| 1971 | 34.5 | 46.0 | 22.0 | 24.0 |
| 1981 | 43.6 | 56.4 | 29.8 | 26.6 |
| 1991 | 52.2 | 64.1 | 39.3 | 24.8 |
| 2001 | 65.4 | 75.9 | 54.2 | 21.7 |
| 2011 | 73.0 | 80.9 | 64.6 | 16.3 |
Table 4 of the textbook: the literacy rate in India, as a percentage of the population 7 years of age and above.

the female line rises fastest, which is why the gap has been closing since
1981.
7.1 The three axes along which literacy varies
Across gender
The literacy rate for women is 16.3 percentage points lower than for men
(80.9% against 64.6% in 2011), but female literacy has been rising faster,
partly because it started from relatively low levels. Between 2001 and 2011 (Table 4)
female literacy rose by about 10.4 points (54.2% to 64.6%), male literacy by
about 5 points (75.9% to 80.9%), and total literacy by about 7.6 points
(65.4% to 73.0%).
Across social groups
Historically disadvantaged communities like the Scheduled Castes and Scheduled
Tribes have lower literacy rates, and female literacy within these groups is
lower still. The two disadvantages stack.
Across regions
Regional variations are still very wide, with Kerala approaching universal
literacy while Bihar lags far behind.
Inequalities in the literacy rate are specially important because they tend to
reproduce inequality across generations: illiterate parents are at a severe
disadvantage in ensuring their children are well educated, perpetuating existing
inequalities.
8 Rural-Urban Differences
The vast majority of India’s population has always lived in rural areas and still
does: the Census of India 2011 puts 68.8% rural and 31.2% urban. The urban
share rose from about 11% at the start of the twentieth century to about 28% at the
start of the twenty-first, about two-and-a-half times.
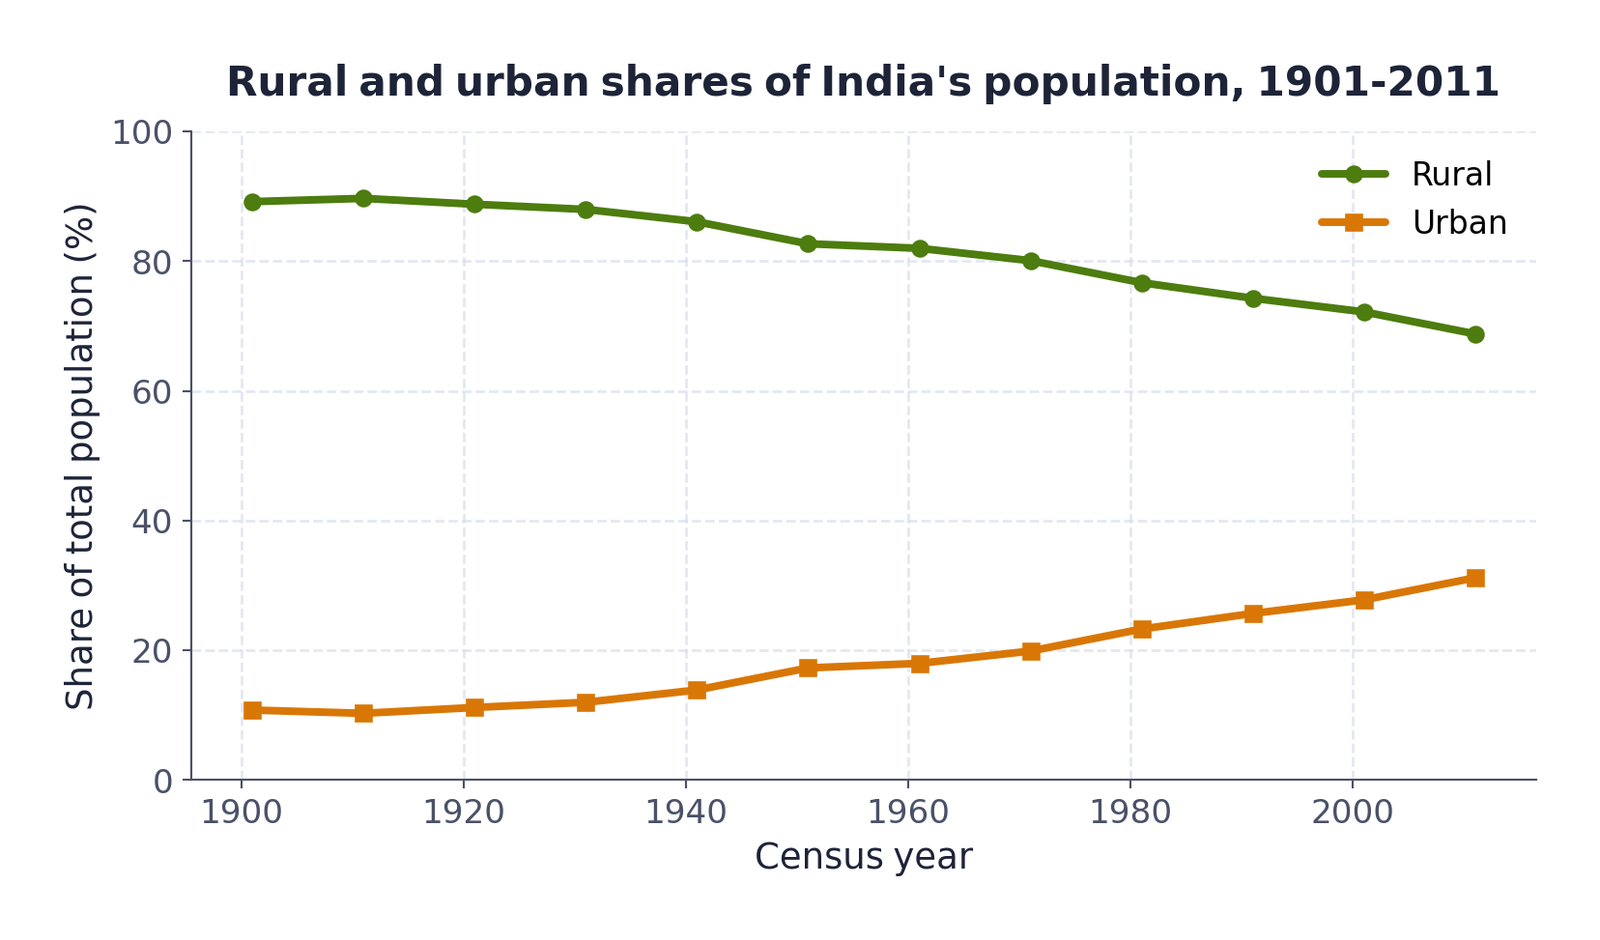
2011.
| Year | Rural (millions) | Urban (millions) | Rural (%) | Urban (%) |
|---|---|---|---|---|
| 1901 | 213 | 26 | 89.2 | 10.8 |
| 1921 | 223 | 28 | 88.8 | 11.2 |
| 1951 | 299 | 62 | 82.7 | 17.3 |
| 1971 | 439 | 109 | 80.1 | 19.9 |
| 1991 | 629 | 218 | 74.3 | 25.7 |
| 2001 | 743 | 286 | 72.2 | 27.8 |
| 2011 | 833 | 377 | 68.8 | 31.2 |
Selected rows from Table 5 of the textbook, which gives every census year from 1901 to 2011.
It is not a question of numbers alone. Modern development makes the economic
and social significance of the agrarian-rural way of life decline relative to the
industrial-urban way of life, broadly true all over the world and in India too.
Agriculture used to be by far the largest contributor to the country, but today it
contributes about one-sixth of the gross domestic product, so although the majority
still live in rural areas and make their living from agriculture, the relative
economic value of what they produce has fallen drastically. Many villagers no longer
work in agriculture, or even in the village: they take up non-farm rural
occupations like transport services, business enterprises or craft manufacturing, or
commute daily to the nearest urban centre.
8.1 The village is no longer sealed off
Mass media and communication channels now bring images of urban life styles
and patterns of consumption into the rural areas, so urban norms are well known even in
remote villages, creating new desires and aspirations for consumption. Mass
transit and mass communication are bridging the rural-urban gap. Rural areas were never
really beyond the reach of market forces even in the past, and today they are more
closely integrated into the consumer market.
8.2 Why people move to the city
Work
The town or city acts as a magnet. Those who cannot find work, or
sufficient work, in rural areas go to the city in search of work.
The loss of common property resources
Migration is accelerated by the continuous decline of common property
resources like ponds, forests and grazing lands, which let poor people survive in
the villages although they owned little or no land. These have been turned into
private property, or they are exhausted: ponds run dry, forests are cut down.
People must then buy in the market what they used to get free, like fuel,
fodder or supplementary food, while opportunities for earning cash income are
limited in the villages.
The anonymity of the city
The city is sometimes preferred for social reasons, specially the
relative anonymity it offers. For socially oppressed groups like the
Scheduled Castes and Scheduled Tribes it offers partial protection from the
daily humiliation of a village where everyone knows their caste identity. It also
lets the poorer sections of socially dominant rural groups do low status
work they could not do at home.
8.3 The metros grow fastest
It is the biggest cities, the metropolises, that grow fastest, attracting
migrants from rural areas and from small towns.
The larger cities grow so rapidly that the urban infrastructure can hardly keep
pace. With the mass media focused on them, the public face of India is becoming
more and more urban rather than rural. Yet in the political power dynamics of the
country, the rural areas remain a decisive force. India looks urban and votes
rural.
9 Population Policy in India
Population dynamics crucially affects a nation’s developmental prospects and the
health and well-being of its people, particularly in developing countries. India has had
an official population policy for more than half a century, and was perhaps the first
country in the world to explicitly announce such a policy, in 1952.
9.1 From family planning to family welfare
The policy took the concrete form of the National Family Planning Programme,
whose broad objective never changed: to influence the rate and pattern of population
growth in socially desirable directions. Its early objectives were to slow growth
through birth control methods, to improve public health standards, and to
increase public awareness about population and health issues.
9.2 The Emergency setback
The Family Planning Programme suffered a setback during the National Emergency,
1975-76. Normal parliamentary and legal procedures were suspended, and special
laws and ordinances issued directly by the government, without being passed by
Parliament, were in force.
Sterilisation refers to medical procedures that prevent conception and
childbirth. The two named in the chapter are vasectomy, for men, and
tubectomy, for women.
The government tried to bring down the growth rate with a coercive programme of
mass sterilisation. Vast numbers of mostly poor and powerless people were forcibly
sterilised, and lower-level officials such as school teachers and office workers were
put under massive pressure to bring people to the sterilisation camps. There was
widespread popular opposition, and the new government elected after the
Emergency abandoned it.
Do not write that the Family Planning Programme was abandoned. What was abandoned
was the coercive sterilisation drive; the programme continued as the National
Family Welfare Programme, with a broader set of socio-demographic objectives.
9.3 India’s demographic transition today
Census data suggest population growth has been on the decline since 1991. The
average number of children a woman expected to give birth to in her life was 3.8 in
1990 and has fallen to 2.7 today (Bloom, 2011). Even so, India’s population is
projected to rise from 1.2 billion today to an estimated 1.6 billion by 2050, and
the reason has a name.
Population momentum is a situation where a large cohort of women of
reproductive age fuels population growth over the next generation, even if each woman
has fewer children than previous generations did.
Picture a large cohort of women who are of reproductive age now. Even if each has
fewer children than the previous generation did, their numbers keep total births, and
the population, rising over the next generation. That is population momentum.
The drop in the crude death rate (CDR) and the crude birth rate (CBR)
over the past four decades indicates that India is progressing towards a
post-transitional phase. From 1950 to 1990 the drop in CBR was less steep than
the drop in CDR; during the 1990s the decline in CBR was steeper, giving a
reduced annual population growth rate of 1.6% today (Planning Commission,
2008).
9.4 The National Health Policy 2017
| Goal | Target |
|---|---|
| Government health expenditure as a percentage of GDP | From 1.15% to 2.5% by 2025 |
| Life expectancy at birth | From 67.5 to 70 by 2025 |
| Total fertility rate, national and sub-national | Reduce to 2.1 by 2025 |
| Under-five mortality | Reduce to 23 by 2025 |
| Maternal mortality rate | Reduce to 100 by 2020 |
| Neo-natal mortality and still birth rate | 16, and a “single digit” still birth rate, by 2025 |
| Stunting of under-five children | 40% relative reduction by 2025 |
Selected goals from Box 2.5, which also sets targets for the DALY Index (tracking by 2022), the 90:90:90 HIV/AIDS goal, a TB cure rate above 85% with elimination by 2025, immunisation, antenatal care, blindness, tobacco use, safe water and sanitation, and state health spending.
While the state can do a lot to try and create the conditions for demographic
change, most demographic variables, specially those related to human fertility, are
ultimately matters of economic, social and cultural change.
the closing lesson of the chapter, and a useful closing line for a long answer
- Demography = systematic study of population; formal demography measures, social demography explains. Durkheim’s suicide study showed a rate is a social fact. Census: 1790 America, India 1867-72, decennial from 1881, seven since 1951, latest 2011, the world’s largest
- Malthus (1766-1834, Essay on Population 1798): population geometric, food arithmetic, poverty permanent; preventive checks voluntary, positive checks famine and disease. Disproved by European experience and by critics who blamed unequal distribution
- Demographic transition, three stages: low growth (both rates high), very high growth (transition), low growth again (both rates low). The middle explodes because death rates fall fast and birth rates are socio-cultural and slow. India’s transition is incomplete
- India 2011: 121 crores, second after China; growth -0.03% in 1911-21, peak 2.2% in 1961-81; after 1921 to 1931 the birth and death rates diverge. Famine and epidemic control cut the death rate, and Amartya Sen showed famine is a failure of entitlements
- Fertility: TFR 1.7 in AP, HP, Punjab, TN, WB (2016), Kerala below replacement; Bihar 3.3, UP 3.1, MP 2.8, Rajasthan 2.7; UP and Bihar supply almost half the additions to 2041 (Economic Survey 2018-19; Chart 2 shows 28% of growth)
- Age structure 1971 to 2011: under-15 42% to 29%, 15-59 53% to 63%, 60+ 5% to 8%; 2026 projection 23 / 64 / 12
- Demographic dividend: total dependency ratio 79 (1970), 64 (2005); age-based ratio projected 48 (2025), 50 (2050); average Indian 29 in 2020 against 48 in Japan. Not automatic, it needs education and employment
- Sex ratio 972 (1901), 927 (1991 low), 943 (2011); child sex ratio 976 (1961) to 919 (2011), below the overall ratio for the first time in 2001. Causes: neglect, sex-specific abortion, female infanticide; it is difficult to see how maternal mortality could be responsible. Haryana 793 worst, Arunachal Pradesh 972 best, lowest ratios in the richest states. PNDT Act 1996, strengthened 2003; Beti Bachao, Beti Padhao
- Literacy 2011: 73.0 overall, 80.9 male, 64.6 female, gap 16.3; Kerala near universal, Bihar behind, SC and ST lower still; the inequality reproduces itself across generations
- Rural-urban: 68.8 / 31.2 in 2011; agriculture about one-sixth of GDP; 5,161 towns and cities; 27 million-plus cities hold over two-thirds of the urban population. People migrate for work, for lost common property resources, and for anonymity
- Policy: 1952 onwards; Emergency 1975-76 coercive sterilisation abandoned; renamed National Family Welfare Programme; NPP 2000; National Health Policy 2017 incorporates these goals. Population momentum takes India to 1.6 billion by 2050 though TFR is down from 3.8 to 2.7. The state creates the conditions; fertility is ultimately economic, social and cultural