- State the exact NCERT definition of a map, and explain why a scale-less sketch is not a map
- List and explain the five essentials every cartographer works through while making any map
- Name the key milestones and people in the history of map making, in India and abroad
- Classify maps by scale (large-scale vs small-scale) and by function (physical vs cultural)
- Measure distance, direction and area off a map, including the area formula and the planimeter
1What Is a Map?
You already know the earth is a geoid, a three-dimensional, slightly
flattened sphere, and that a globe is the best way to represent it in three
dimensions. A map, on the other hand, squeezes the whole earth or any part of
it onto a flat sheet of paper. That is why a map is always a
two-dimensional form of a three-dimensional earth, and why drawing one
needs a system of map projection (Chapter 24).
A map is a selective, symbolised and generalised representation of
the whole or a part of the earth’s surface on a plane surface, at a reduced
scale.
Since it is impossible to show every real-world feature at its true size
and shape, a map is always drawn at a reduced scale: think of your own
school campus. A map of it drawn at actual size would be exactly as big as
the campus itself, which defeats the purpose. So every map is built on a
scale and a projection, so that each point on the paper corresponds correctly
to a real position on the ground. Features are simplified further using
symbols, colours and shades.
Any set of lines and shapes drawn without a scale is not a
map. It is only a “sketch”. NCERT’s own example: a freehand sketch of the
area around Delhi looks similar to a map of Delhi, but only the map is
drawn to scale and can be measured; the sketch cannot.
Map
- Drawn to a fixed scale and projection
- Every point corresponds to a real ground position
- Distances and areas can be measured accurately
Sketch
- Freehand, no true scale or orientation
- Only an approximate impression of shape
- Cannot be measured reliably
Sketch map: a simplified map drawn freehand which fails to
preserve the true scale or orientation.
2Essentials of Map Making
Maps look extremely different from each other: a wall map of the world
and a village land-record map share almost nothing in appearance. Yet
cartography (the art, science and technology of making maps) puts
every single one of them through the same five processes.
Cartography: the art, science and technology of making maps,
charts, plans and other modes of graphical expression, as well as their
study and use.
Scale
The very first decision a map-maker makes. Scale fixes how much
information and how much real detail the map can carry: a map at a
bigger scale can show more, and more accurately.
Map Projection
The system used to transform the curved, all-sides-curved geoidal
surface onto a flat sheet. This transformation always introduces some
unavoidable change in direction, distance, area or shape.
Map Generalisation
Selecting and simplifying the map’s content to suit its purpose. A
general-purpose map shows relief, drainage, vegetation, settlement and
transport; a special-purpose map focuses on one theme, e.g. population
density, soil type or industry location.
Map Design
Planning every graphic detail: the symbols used, their size and form,
lettering style, line widths, colours and shades, how elements are
arranged, and the design of the map’s legend.
Map Construction and Production
Actually drawing and reproducing the map. Once done entirely by hand
with pen, ink and mechanical printing; today revolutionised by
computer-assisted mapping and photo-printing.
Map generalisation: a simplified representation of the features
on a map, appropriate to its scale or purpose, without affecting their true
visual form.
“List the essentials of map making” is a very common 3-5 mark question.
Give all five in order: Scale, Projection, Generalisation, Design,
Construction and Production, one mark for each, in this sequence.
3History of Map Making
Map making is as old as human history itself.
The Vedic-period “siddhantas” that laid India’s map-making foundation
were about astronomy and the shape of the cosmos, not paper maps as we know
them today. The geographic surveying tradition came much later, with
Todarmal and then the Survey of India.
4Types of Maps: Based on Scale
On the basis of scale, maps fall into two broad groups.
| Group | Sub-type | Typical scale | What it shows |
|---|---|---|---|
| Large-scale | Cadastral map | 1 : 500 to 1 : 4,000 (village); 1 : 2,000 or larger (city) | Ownership/boundaries of agricultural land and individual house plots |
| Topographical map | 1 : 2,50,000 · 1 : 50,000 · 1 : 25,000 | Relief, drainage, agricultural land, forest, settlement, communication, schools, post offices, shown in uniform colours and symbols | |
| Small-scale | Wall map | Larger than atlas maps, smaller than topographical maps | General reference for classroom / lecture-hall use, on large paper or plastic sheets |
| Atlas map | Very small scale | A “graphic encyclopaedia” of location, relief, drainage, climate, vegetation, population, industry, transport, tourism for the world, a continent, a country or a region |
Cadastral map: a large-scale map drawn at a scale of 1 : 500 to
1 : 4,000 to show property boundaries, designating each parcel of land with
a number. The word comes from the French cadastre, meaning “register
of territorial property”.
Students often assume “large-scale” means “map of a large area”. It is
the opposite: a large map scale (like 1:4,000) shows a
small area in great detail; a small scale (like the one on an
atlas page) shows a huge area in a generalised way.
5Types of Maps: Based on Function
Maps can also be classified by what they are for. Broadly, this gives
physical maps and cultural maps.
| Category | Type | What it shows |
|---|---|---|
| Physical maps | Relief map | General topography: mountains, valleys, plains, plateaus, drainage |
| Geological map | Geological structures and rock types | |
| Climatic map | Climatic regions; temperature, rainfall, cloudiness, humidity, wind direction and speed | |
| Soil map | Distribution of soil types and their properties | |
| Cultural maps | Political map | Administrative divisions: country, state, district; used for administrative planning |
| Population map | Distribution, density, growth, age-sex structure, religious/linguistic/social group distribution, occupation | |
| Economic map | Production and distribution of crops and minerals, location of industries and markets, trade routes, commodity flow | |
| Transportation map | Roads, railway lines, railway stations, airports |
“Distinguish between physical and cultural maps” is a favourite 3-mark
question. One line is enough: physical maps show what nature made,
cultural maps show what people made. Then give one example of each.
6Uses of Maps
Geographers, planners and other resource scientists use maps constantly
to measure three things: distance, direction and area.
6.1 Measurement of distance
Linear features on a map are either straight or erratic (zigzag).
Straight-line features
- Roads, railway lines, canals
- Measured directly with a pair of dividers, or a scale placed on the map
Erratic / zigzag features
- Coastlines, rivers, streams
- Measured with a thread laid along the path, then stretched and measured, or with a rotameter
Scale: the ratio between the distance of two points on a map,
plan or photograph, and the actual distance between the same two points on
the ground.
6.2 Measurement of direction
Direction is an imaginary straight line on the map showing the angular
position of a feature relative to a common base direction. The line pointing
to north is always the zero, or base, direction. Every map shows north, and
every other direction is fixed relative to it.
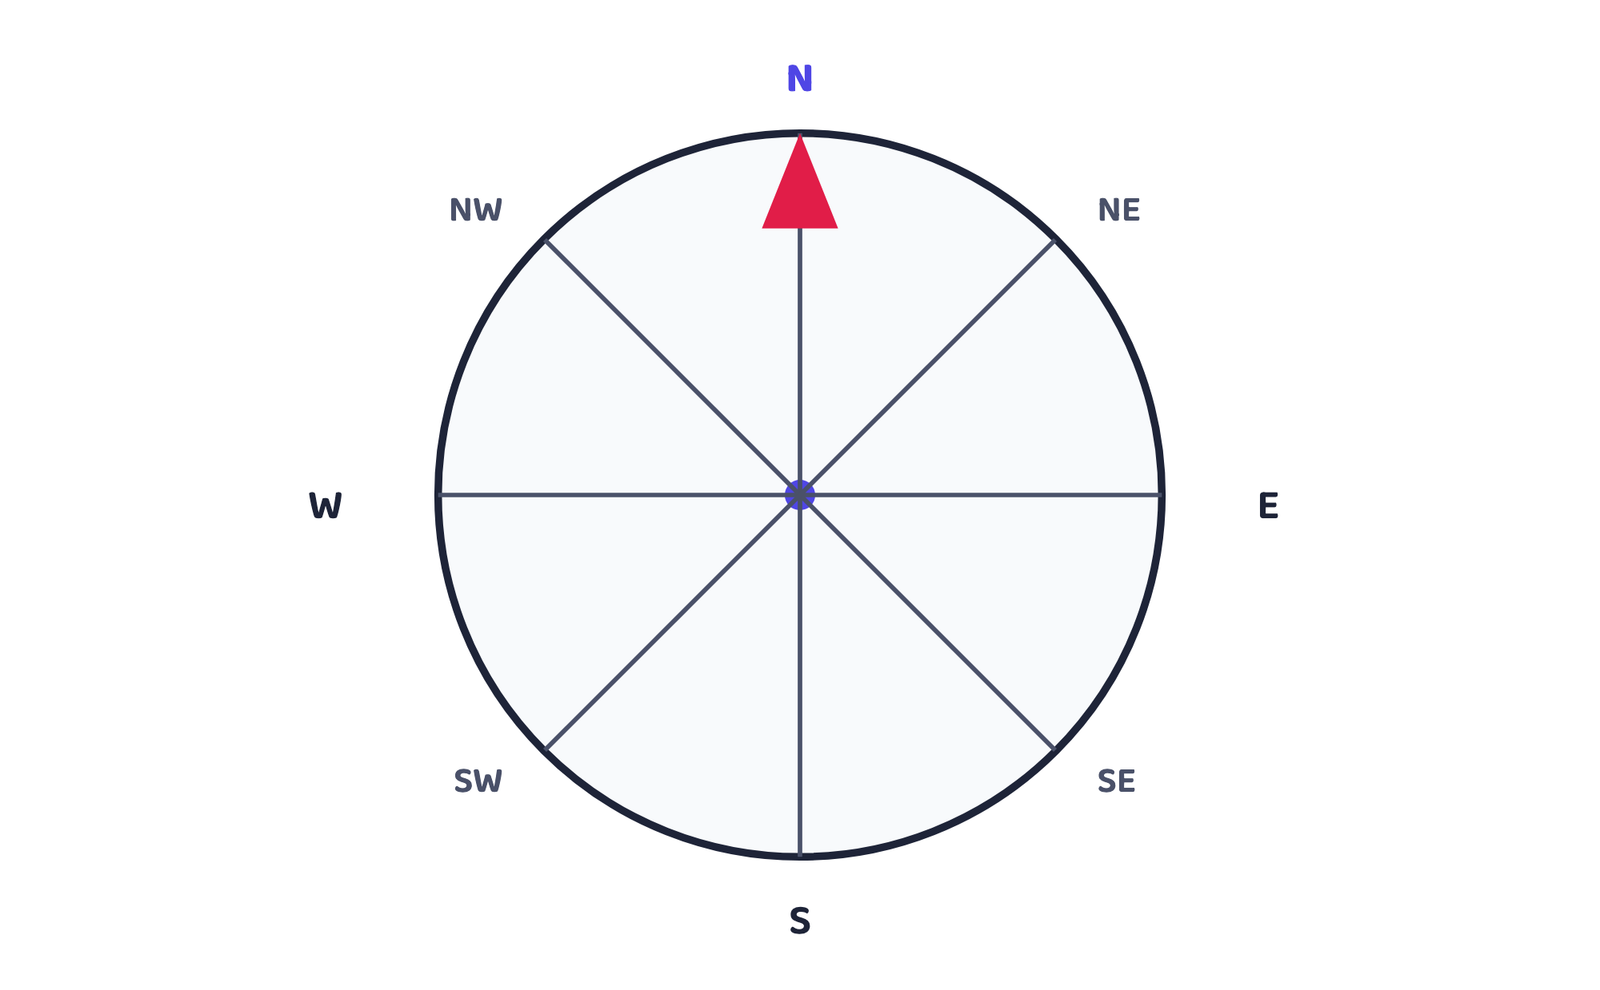
Cardinal points: North (N), South (S), East (E) and West (W),
the four commonly known directions. Several intermediate directions
(NE, SE, SW, NW) lie between them.
6.3 Measurement of area
Area of a feature, such as an administrative unit, a lake or a forest
block, is measured directly on the map surface. The simplest, though not
very accurate, method uses a regular grid of squares.
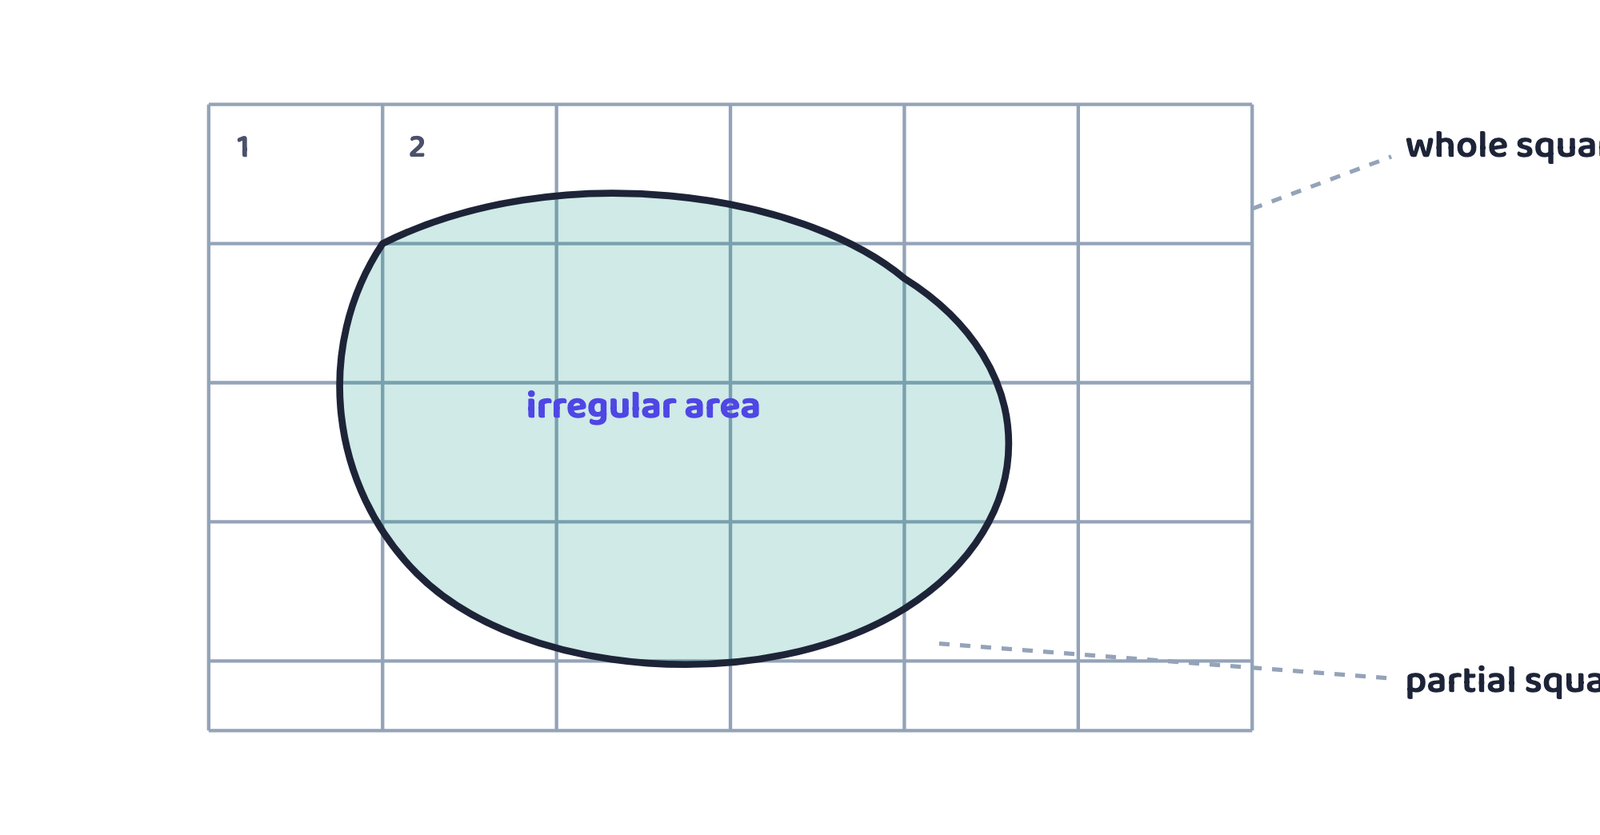
Given
Whole squares covered = 42; partly-covered squares = 16; each square on the ground = 4 hectares
Find
The actual area of the feature
Step 1: Whole squares + half of partial squares = 42 + (16 ÷ 2) = 42 + 8 = 50 squares
Step 2: Multiply by the ground value of one square: 50 × 4 hectares
Answer: Area = 200 hectares
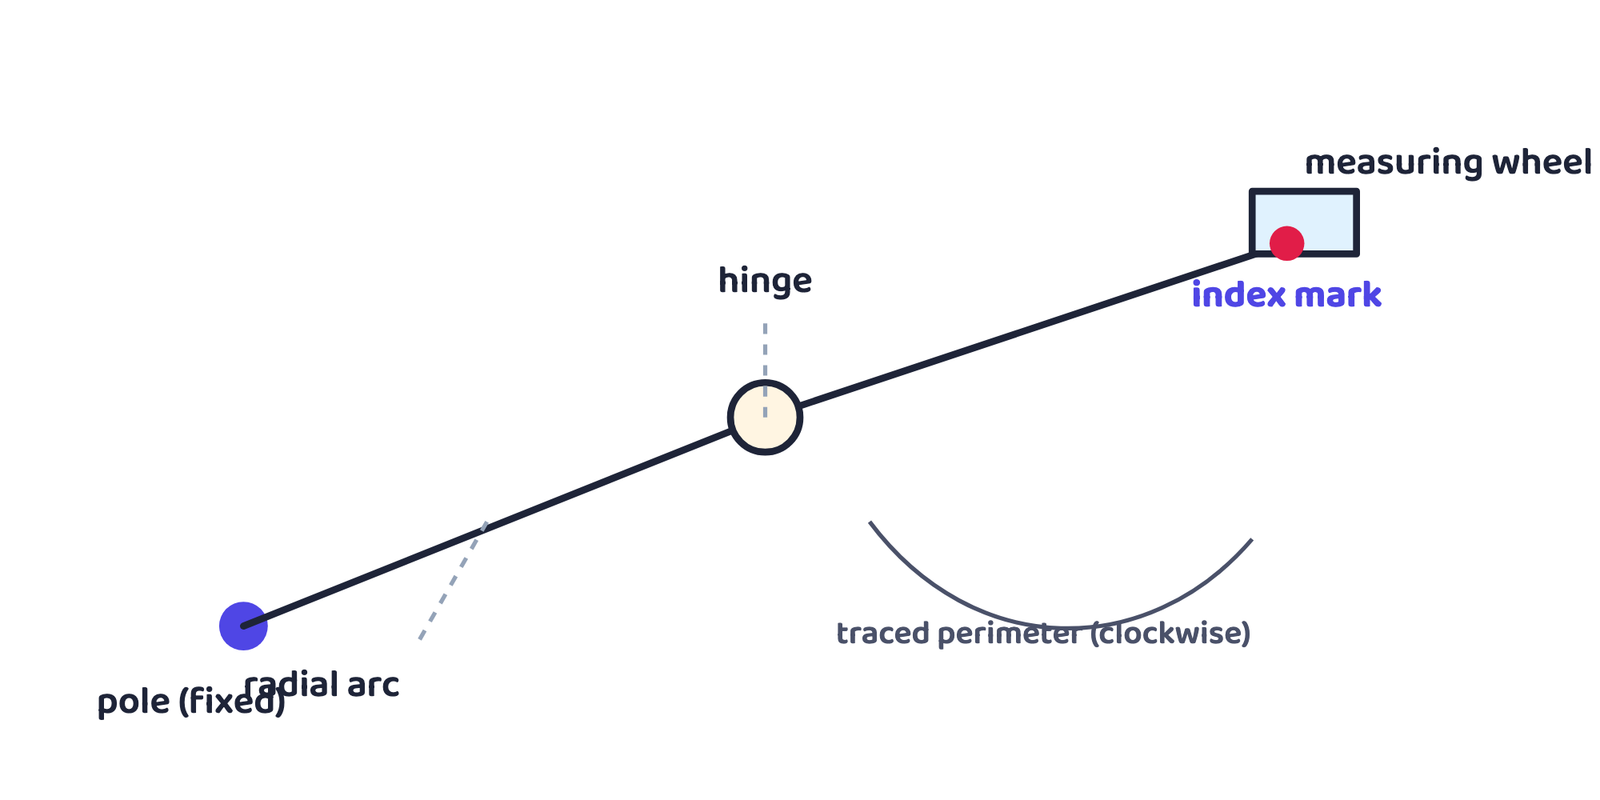
A more accurate instrument for measuring area is the polar
planimeter.
For a 3-mark question on area measurement, name both methods, the
square-counting method and the polar planimeter, and add that the
planimeter is the more accurate of the two.
- A map is a selective, symbolised, generalised representation of the earth on a plane surface at a reduced scale. A scale-less drawing is only a sketch
- Five essentials of map making, in order: Scale → Projection → Generalisation → Design → Construction and Production
- Oldest known map: Mesopotamia, clay tablet, 2,500 B.C.; Survey of India founded 1767, map of Hindustan completed 1785
- By scale: large-scale (cadastral, topographical) shows small areas in detail; small-scale (wall, atlas) shows large areas generalised
- By function: physical maps (relief, geological, climatic, soil) vs cultural maps (political, population, economic, transportation)
- Maps measure distance (dividers/thread/rotameter), direction (cardinal + intermediate points) and area (square-counting formula or polar planimeter)
- Can I write the exact NCERT definition of a map, word for word?
- Can I list all five essentials of map making in the right order?
- Can I name three milestones in India’s map-making history with their dates or names?
- Can I place cadastral, topographical, wall and atlas maps correctly on a large-scale/small-scale ladder?
- Can I state the area formula from memory and use it on a numerical?
- 1 markWhich one of the following is essential for a network of lines and polygons to be called a map?
(a) Map Legend(b) Symbols(c) North Direction(d) Map Scale - 1 markA map bearing a scale of 1 : 4,000 and larger is called:
(a) Cadastral map(b) Topographical map(c) Wall map(d) Atlas map - 1 markWhich one of the following is NOT an essential element of maps?
(a) Map Projection(b) Map Generalisation(c) Map Design(d) History of Maps - 1 markThe oldest known map, found in Mesopotamia, was drawn on a:
(a) papyrus scroll(b) clay tablet(c) palm leaf(d) stone slab - 1 markTodarmal’s main contribution to map making was linking it with:
(a) military campaigns(b) revenue collection(c) trade routes(d) astronomy - 1 markThe Survey of India was established in the year:
(a) 1767(b) 1785(c) 1857(d) 1947 - 1 markA map showing the distribution of rock types and geological structures is a:
(a) Relief map(b) Geological map(c) Soil map(d) Climatic map - 1 markWhich of these is a cultural map, not a physical map?
(a) Relief map(b) Soil map(c) Population map(d) Climatic map - 1 markThe instrument used to measure distance along a zigzag route on a map is a:
(a) planimeter(b) rotameter(c) barometer(d) protractor - 1 markAtlas maps and wall maps are both examples of:
(a) large-scale maps(b) small-scale maps(c) cadastral maps(d) topographical maps
Reason (R): A scale is what allows every point on the drawing to correspond to a real position on the ground.
Reason (R): A larger map scale allows more real-world detail to be shown for the same area of paper.
Reason (R): Astronomical and cosmological ideas from that period were crystallised into “siddhantas” by scholars such as Aryabhata, Varahamihira and Bhaskara.
- 1 markDefine cartography in one line.
- 1 markWhat is a geoid?
- 1 markName the two broad categories of maps based on scale.
- 1 markName any two cardinal points.
- 3 marksWhat is map generalisation?
- 3 marksWhy is map design important?
- 3 marksWhat are the different types of small-scale maps?
- 3 marksList out the two major types of large-scale maps.
- 3 marksHow is a map different from a sketch?
- 3 marksDistinguish between a wall map and an atlas map.
- 3 marksWhy can a scale-less network of lines and polygons not be called a map?
- 5 marksWrite an explanatory account of the types of maps.
- 5 marksDescribe the five essentials of map making, explaining each in your own words.
- 5 marksTrace the history of map making, in the world and in India, with the important dates and names you have studied.
- 5 marksExplain the two methods used to measure the area of a feature on a map. Include the area formula in your answer.
- 3 marksA feature on a map is covered by 60 whole squares and 20 partial squares of a grid. If each square represents 2.5 hectares on the ground, find the actual area of the feature.