
Covers T.R. Jain & V.K. Ohri (2026-27) ch 4. Based on NCERT Indian Economic Development, Chapter 4 (Reprint 2026-27) and the CBSE 2026-27 curriculum (Unit 7: Human Capital Formation).
Board note: CBSE teaches this book in Class 12; UP, Bihar, Rajasthan and MP Boards teach it in Class 11.
- Tell apart human resource, human capital, human capital formation and human development
- Explain the five sources of human capital with examples
- Write the similarities and differences between physical capital and human capital
- Explain how human capital, economic growth and human development are linked
- Give the reasons for government intervention in education and health, and read the expenditure figures
- Draw conclusions from the data in Tables 4.1 and 4.2
1 Introduction: why does education matter so much?
The chapter opens with Alfred Marshall. He argued that public and private spending on education should not be judged only by its direct results, because education brings out the hidden abilities of many people who would otherwise have died unknown.
- Humans stored and passed on knowledge through conversation, songs and lectures
- They soon found that doing things efficiently needs training and skill
- The labour skill of an educated person is more than that of an uneducated person
- So the educated person earns more, and contributes more to economic growth
1.1 Other benefits of education
Social standing
Education gives a better social standing and pride
Better choices
It enables a person to make better choices in life
Understanding society
It gives knowledge to understand the changes taking place in society
Innovation
It stimulates innovations; an educated labour force adapts to new technologies
If a question says “education is not sought only for higher income”, write the four benefits above as four separate points. The book’s Fig. 4.1 makes the same point: adequate education and training to farmers can raise productivity in farms.
2 What is human capital?
Just as a country can turn physical resources like land into physical capital like factories, it can turn human resources like nurses, farmers, teachers and students into human capital like engineers and doctors.
Human capital is the enhanced labour productivity (skill and ability) of people, acquired through deliberate investment in education, health, training and so on, with the expectation that it will increase future income.
Human capital formation is the process of turning human resources into human capital through investment in education, health, on-the-job training, migration and information.

- Societies first need enough human capital: competent people who are themselves educated and trained as professors and other professionals
- In other words, we need good human capital to produce other human capital (say, nurses, farmers, teachers, doctors, engineers)
- So investment in human capital is needed to turn human resources into human capital
The book builds the chapter around four questions:
3 Sources of human capital
Investment in education is one of the main sources of human capital. Spending on health, on-the-job training, migration and information are the other sources.

3.1 Expenditure on education
- Spending on education by individuals is like spending on capital goods by companies
- A company spends on capital goods to increase its future profits over a period of time
- Likewise, individuals invest in education to increase their future income
3.2 Expenditure on health
- Like education, health is an important input for the development of a nation as well as of an individual
- A sick labourer without access to medical facilities has to stay away from work, and productivity is lost
- Health expenditure directly increases the supply of healthy labour force, so it is a source of human capital
| Form of health expenditure | Meaning |
|---|---|
| Preventive medicine | Prevention before illness, such as vaccination |
| Curative medicine | Medical intervention during illness |
| Social medicine | Spread of health literacy |
| Clean drinking water and good sanitation | Spending on safe water and sanitation |
3.3 On-the-job training
On-the-job training is training that a firm gives its workers at its own cost, so that their labour productivity rises.
Form 1: inside the firm
- At the firm’s own workplace
- Under the supervision of a skilled worker
Form 2: outside the firm
- Workers are sent for off-campus training
- At another place or institute
- In both forms the firm incurs some expense
- So the firm insists that the worker works for it for a specific period after the training
- In that period the firm recovers the benefit of the enhanced productivity
- It is a source of human capital because the return (higher labour productivity) is more than its cost
3.4 Expenditure on migration
- People migrate in search of jobs that pay higher salaries than in their native places
- Unemployment is the reason for rural-urban migration in India
- Technically qualified persons like engineers and doctors migrate to other countries for higher salaries
Cost of transport
The cost of moving from one place to another
Higher cost of living
Living costs more in the new place
Psychic costs
The strain of living in a strange socio-cultural setup
Even with these costs, the enhanced earnings in the new place outweigh the costs of migration, so expenditure on migration is a source of human capital formation.
3.5 Expenditure on information
- People spend to get information about the labour market and other markets such as education and health
- For example: the salaries of different jobs, whether institutions give the right employable skills, and at what cost
- This information is needed to make decisions on investment in human capital
- It is also needed for the efficient utilisation of the human capital stock already acquired
“E-H-O-M-I”
Education, Health, On-the-job training, Migration, Information: the five sources of human capital.
When the question asks for the “two major sources”, do not list all five. The book calls education and health very important sources (book Section 4.5). Write all five only when the question asks for “sources” or “factors”.
4 Physical capital and human capital (Box 4.1)
The concept of physical capital is the base for the concept of human capital. The two have some similarities and some striking differences.
4.1 Similarity: both come from conscious investment decisions
- Physical capital: the entrepreneur calculates the expected rates of return of different investments and rationally decides which one to make
- So physical capital formation is mainly an economic and technical process
- Human capital: a substantial part is formed at an age when a person cannot decide whether it will maximise her or his earnings
- Parents and society decide children’s schooling and health care
- Even at the tertiary (college) level, peers, educators and society influence the decision
- Human capital formation at this level depends on the human capital already formed at school level
- So human capital formation is partly a social process and partly a conscious decision of its possessor
4.2 Differences between physical capital and human capital
| Basis | Physical capital | Human capital |
|---|---|---|
| Nature | Tangible, such as a bus | Intangible; built into the body and mind of its owner |
| Sale | Can be sold in the market like any commodity | Not sold; only its services are sold |
| Separability | Separable from its owner; the bus owner need not be present where the bus is used | Inseparable from its owner; the bus-driver must be present when the bus is used |
| Mobility | Completely mobile between countries, except for some artificial trade restrictions | Not perfectly mobile; restricted by nationality and culture |
| How it is built | Can be built even through imports | Built through conscious policy suited to the society and economy, and spending by the state and individuals |
| Depreciation | Continuous use wears it out; change of technology makes a machine obsolete | Depreciates with ageing; reduced to a large extent by continuous investment in education and health |
| Technology change | Cannot cope with change in technology | Continuous investment helps it cope with change in technology |
| Benefits | Only private benefit, to those who pay for its products and services | Both private and social benefits (external benefit) |
External benefit is the benefit of human capital that goes not only to its owner but also to society in general.
- An educated person can take part effectively in a democratic process and contribute to the socio-economic progress of the nation
- A healthy person, by maintaining personal hygiene and sanitation, stops the spread of contagious diseases and epidemics
Do not write “human capital does not depreciate”. Both forms of capital depreciate; only the nature differs. A machine wears out and becomes obsolete; human capital depreciates with age, but continuous investment reduces this to a large extent.
5 Human capital and economic growth
Economic growth means the increase in real national income of a country.
- The book asks: who contributes more to national income, a worker in a factory or a software professional?
- The educated person has more labour skill, earns more and so contributes more to economic growth
- A healthy person can supply labour without interruption for a longer time, so health is also a factor of growth
- So education, health, on-the-job training, job market information and migration all raise a person’s income generating capacity
5.1 Why the evidence is unclear: measurement problems
Empirical evidence that more human capital causes economic growth is rather nebulous (unclear). This may be because of measurement problems:
Measures of education
- Years of schooling
- Teacher-pupil ratio
- Enrolment rates
- These may not reflect the quality of education
Measures of health
- Health services in monetary terms
- Life expectancy
- Mortality rates
- These may not reflect the true health status
- Using these indicators for both developing and developed countries shows convergence in the measures of human capital (the gap narrows)
- But there is no sign of convergence of per capita real income
- In other words, human capital grew faster in developing countries, but per capita real income did not grow that fast
5.2 Causality runs in both directions

- Higher income causes the building of a high level of human capital
- A high level of human capital causes growth of income
- So it is difficult to prove a cause-and-effect relation from human capital (education and health) to growth
“Human resources development (read human capital) has necessarily to be assigned a key role in any development strategy, particularly in a country with a large population. Trained and educated on sound lines, a large population can itself become an asset in accelerating economic growth and in ensuring social change in desired directions.”
Seventh Five Year Plan
5.3 Table 4.1: Select indicators of development in education and health sectors
| Particulars | 1951 | 1981 | 1991 | 2001 | 2018-22 |
|---|---|---|---|---|---|
| Real per capita income (₹) | 7,651 | 12,174 | 15,748 | 23,095 | 94,054 |
| Crude death rate (per 1,000 population) | 25.1 | 12.5 | 9.8 | 8.1 | 6.0 |
| Infant mortality rate | 146 | 110 | 80 | 63 | 28 |
| Life expectancy at birth, male (years) | 37.2 | 54.1 | 59.7 | 63.9 | 68.6 |
| Life expectancy at birth, female (years) | 36.2 | 54.7 | 60.9 | 66.9 | 71.4 |
| Literacy rate (%) | 16.67 | 43.57 | 52.21 | 65.20 | 78 |
Source: Economic Survey for various years, Ministry of Finance; National Statistical Office, Ministry of Statistics and Programme Implementation.
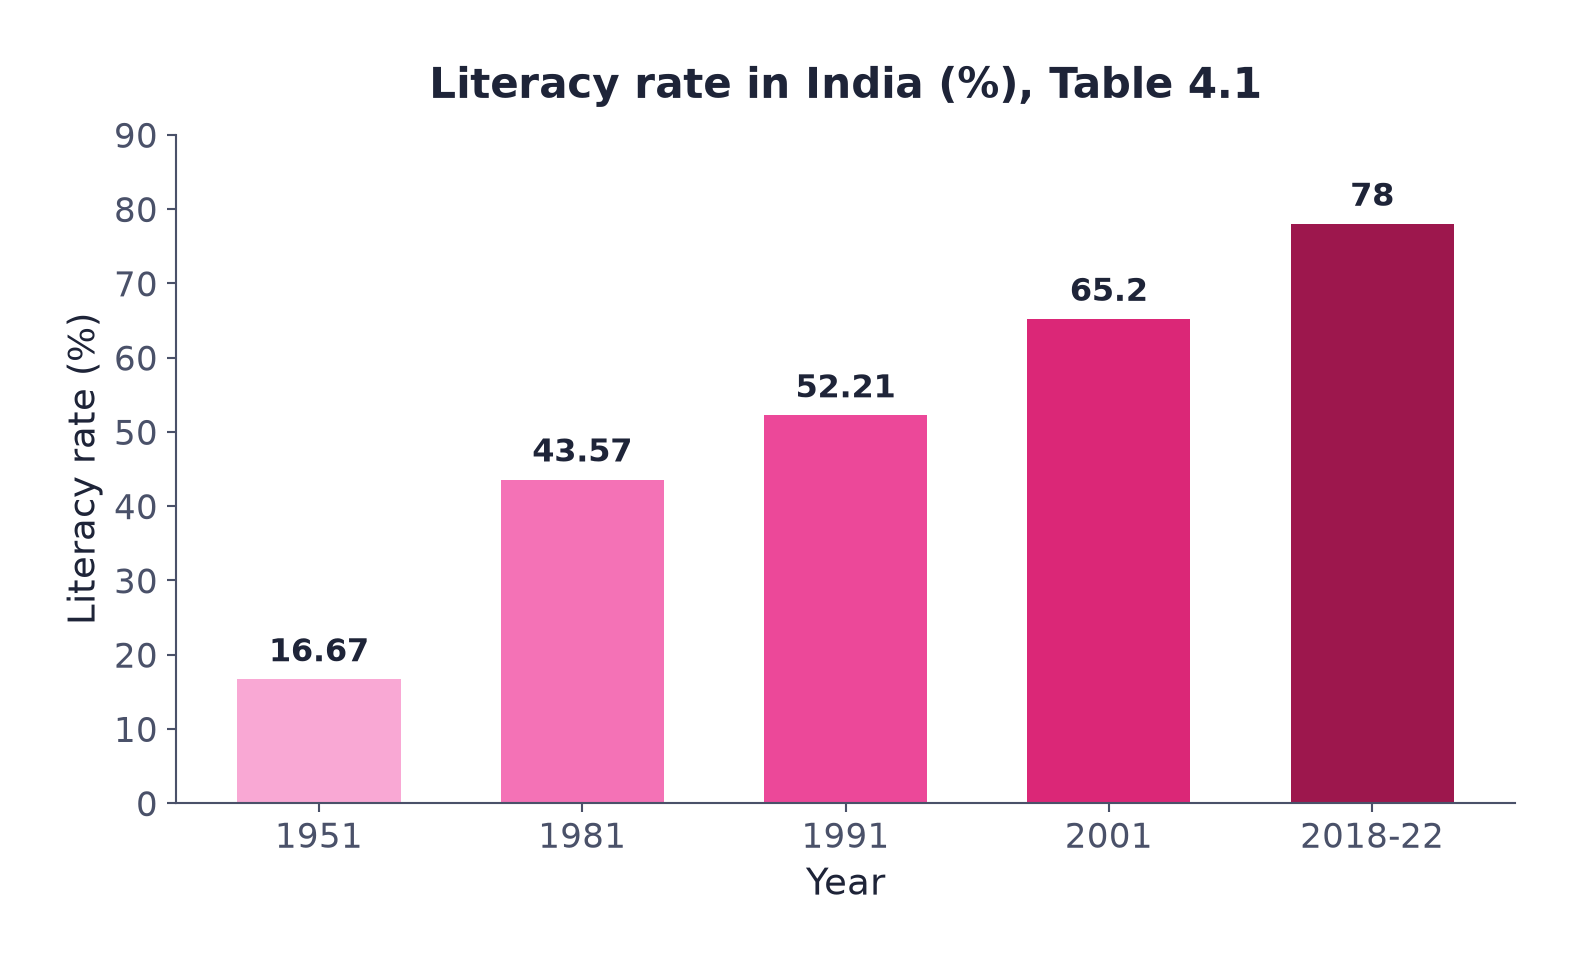
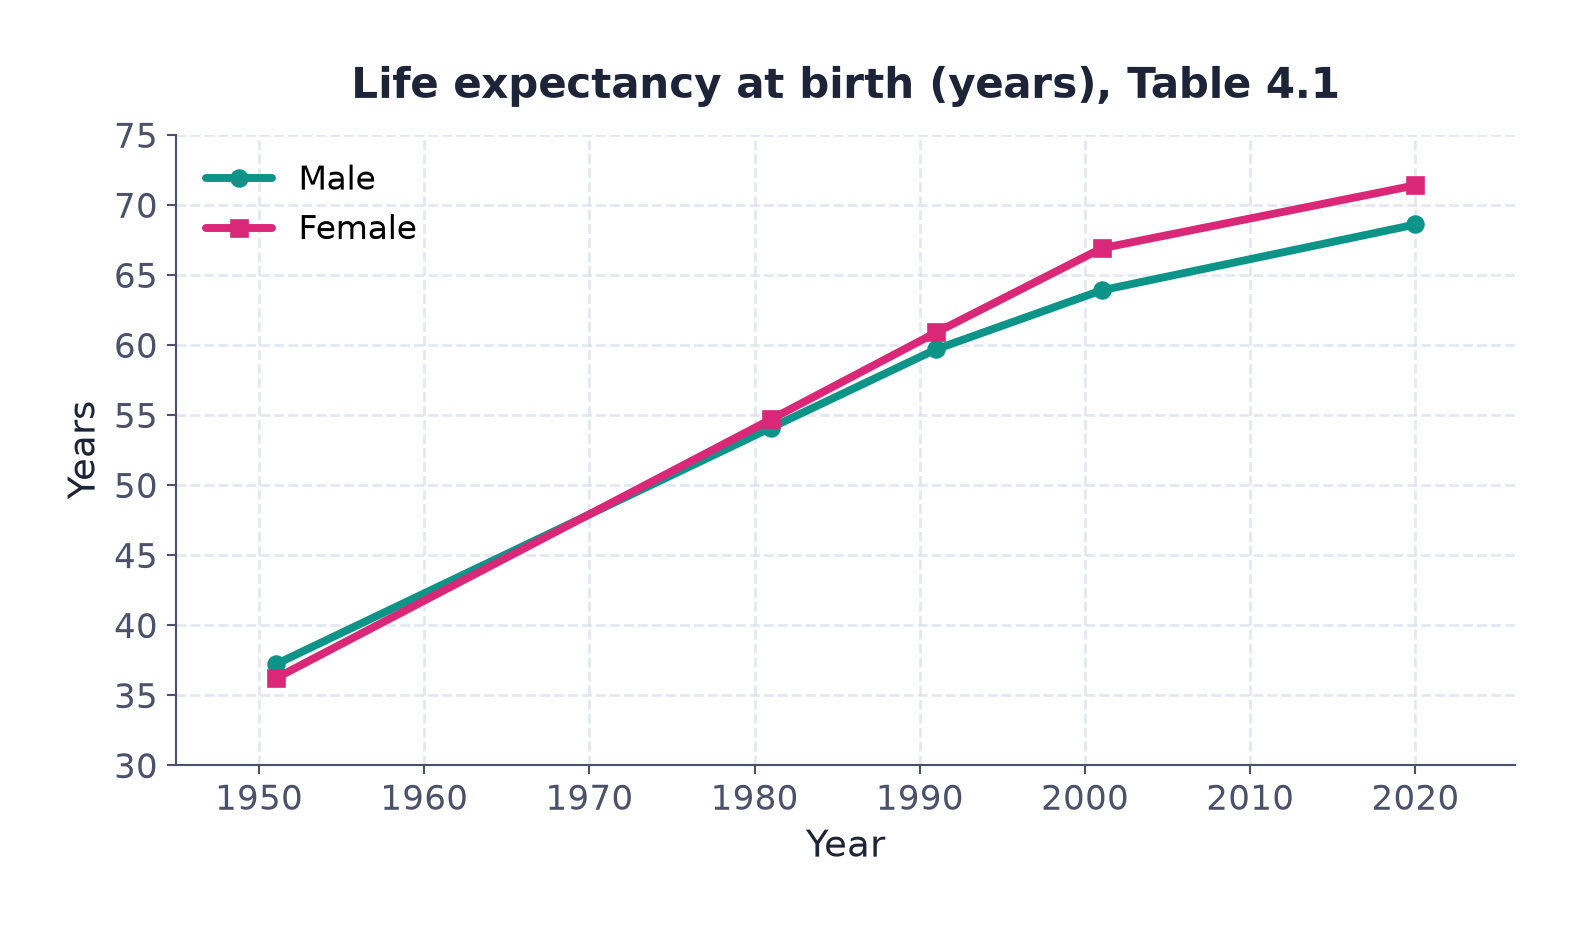
Q. From Table 4.1, find the change in the literacy rate and in the infant mortality rate between 1951 and 2018-22, and write a conclusion.
Given: literacy rate 16.67% (1951), 78% (2018-22); infant mortality rate 146 (1951), 28 (2018-22)
Formula: change = later value − earlier value; percentage fall = fall ÷ initial value × 100
Substitution: rise in literacy = 78 − 16.67 = 61.33 percentage points
fall in IMR = 146 − 28 = 118; percentage fall = 118 ÷ 146 × 100 = about 80.8%
Conclusion: over the same period real per capita income rose from ₹7,651 to ₹94,054. Education, health and income have grown together, and growth in each sector probably reinforced the others.
The difference between two percentages is in percentage points. A rise from 16.67% to 78% is “a rise of 61.33 percentage points”, not “a 61.33% rise”. And do not conclude from the table that “education alone raised income”: the book says causality runs both ways.
5.4 National Education Policy 2020 and the knowledge landscape
- The world is undergoing rapid changes in the knowledge landscape
- With big data, machine learning and artificial intelligence, many unskilled jobs worldwide may be taken over by machines
- The need for a skilled workforce in mathematics, computer science and data science, with multidisciplinary abilities across the sciences, social sciences and humanities, will grow
- Climate change, pollution and depleting natural resources will shift how we meet energy, water, food and sanitation needs
- This needs new skilled labour in biology, chemistry, physics, agriculture, climate science and social science
- Epidemics and pandemics call for collaborative research in infectious disease management and vaccines, which raises the need for multidisciplinary learning
- Demand for humanities and art will grow as India moves towards becoming one of the three largest economies in the world
- The policy vision: human capital formation will move India’s economy to a higher growth trajectory based on the knowledge landscape
5.5 India as a knowledge economy (Box 4.2)
The Indian software industry has shown an impressive record over the past two decades. Entrepreneurs, bureaucrats and politicians suggest India can become a knowledge-based economy using information technology (IT). Villagers using e-mail are cited as examples, and e-governance is projected as the way of the future. But the book cautions that the value of IT depends greatly on the existing level of economic development. Discussion question: will IT-based services in rural areas lead to human development?
6 Human capital and human development
The two terms sound similar, but there is a clear distinction between them.
Human development is based on the idea that education and health are integral to human well-being, because only when people have the ability to read and write and to lead a long and healthy life will they be able to make other choices which they value.
| Basis | Human capital | Human development |
|---|---|---|
| View of education and health | A means to increase labour productivity | Integral to human well-being |
| Role of human beings | A means to an end; the end is higher productivity | Human beings are ends in themselves |
| When is investment worthwhile | Only if it raises the output of goods and services; otherwise unproductive | Welfare should be raised even if productivity does not rise |
| Basic education and health | Valued for their contribution to productivity | Important in themselves; every individual’s right |
| Scope | Narrower | Broader |
“Why is human development broader?” in one line: human capital sees education and health only as means to productivity, while human development treats them as part of well-being and a right of every person, whether or not productivity rises. In a case such as “education helping a person take informed decisions about health and finances” versus “technical training to run machines and raise output”, the first is human development and the second is human capital formation.
7 State of human capital formation in India
- Human capital formation is the outcome of investments in education, health, on-the-job training, migration and information
- Of these, education and health are very important sources
- India is a federal country; the Constitution lays down the functions of each level of government
- So expenditure on education and health is carried out simultaneously by all three tiers of government
- The chapter analyses only the education sector
7.1 Why is government intervention needed?
Education and health care create both private and social benefits. That is why both private and public institutions exist in these markets. Still, the government must intervene because:
Long-term, irreversible impact
If a child is admitted to a school or health centre without the required services, much damage is done before the decision to shift the child is taken
Incomplete information
Consumers do not have complete information about the quality and cost of these services
Monopoly and exploitation
So providers acquire monopoly power and exploit consumers
Poverty
Many people below the poverty line cannot afford basic education and health care; a large section cannot afford super specialty care and higher education
A right of citizens
If basic education and health are rights, the government should provide them free to deserving citizens and the socially oppressed classes
The government should ensure that private providers follow the standards it lays down and charge the correct price.
7.2 Organisations in education and health
| Sector | At union and state level | Main organisations |
|---|---|---|
| Education | Ministries and departments of education | National Council of Educational Research and Training (NCERT), University Grants Commission (UGC), All India Council of Technical Education (AICTE) |
| Health | Ministries and departments of health | National Medical Commission, Indian Council for Medical Research (ICMR) |
Both the union and state governments have been stepping up education spending to reach cent per cent literacy and raise the average educational attainment of Indians.
8 Education sector in India
8.1 Growth in government expenditure on education
Government expenditure on education is expressed in two ways:
(i) As % of total government expenditure
- Shows the importance of education in the government’s scheme of things
- 7.92 in 1952 → 16.54 in 2020
(ii) As % of Gross Domestic Product (GDP)
- Shows how much of people’s income is committed to the development of education
- 0.64 in 1952 → 4.47 in 2020
- The increase has not been uniform; there has been irregular rise and fall
- If private spending by individuals and philanthropic institutions is added, total education expenditure would be much higher
8.2 Elementary vs higher (tertiary) education
- Elementary education takes the major share of total education expenditure
- Higher/tertiary education (colleges, polytechnics, universities) gets the least
- But expenditure per student is higher in tertiary education than in elementary
- This does not mean funds should be transferred from tertiary to elementary education
- Expanding school education needs more teachers trained in higher educational institutions
- So expenditure on all levels of education should be increased
8.3 Differences across states
This difference in spending leads to differences in educational opportunities and attainments across states. It explains the regional differences in educational attainment in India.
8.4 Comparison with the desired level, and government steps
- Against the desired 6 per cent, the current level of a little over 4 per cent is inadequate
- In principle, the goal of 6 per cent has been accepted as a must for the coming years
- The Government of India levies a 2 per cent ‘education cess’ (Definition 7 below)
- The government also sanctions a large outlay for higher education and new loan schemes for students
Education cess is a 2 per cent levy on all Union taxes, whose revenue is earmarked for spending on elementary education.
8.5 Educational achievements in India
Educational achievements of a country are generally shown by three indicators:
Adult literacy rate
Per cent of people aged 15 and above who are literate
Primary completion rate
Per cent of the relevant age group completing primary education
Youth literacy rate
Per cent of people aged 15 to 24 who are literate
| Particulars (Table 4.2) | 1990 | 2000 | 2011 | 2017-18 |
|---|---|---|---|---|
| 1. Adult literacy rate (per cent of people aged 15+) | ||||
| 1.1 Male | 61.9 | 68.4 | 79 | 82 |
| 1.2 Female | 37.9 | 45.4 | 59 | 66 |
| 2. Primary completion rate (per cent of relevant age group) | ||||
| 2.1 Male | 78 | 85 | 92 | 93 |
| 2.2 Female | 61 | 69 | 94 | 96 |
| 3. Youth literacy rate (per cent of people aged 15 to 24) | ||||
| 3.1 Male | 76.6 | 79.7 | 90 | 93 |
| 3.2 Female | 54.2 | 64.8 | 82 | 90 |

Q. Using Table 4.2, find the male-female gap in adult and youth literacy in 1990 and 2017-18. What do you conclude?
Formula: gender gap = male rate − female rate (in percentage points)
Adult literacy: 1990: 61.9 − 37.9 = 24 points; 2017-18: 82 − 66 = 16 points
Youth literacy: 1990: 76.6 − 54.2 = 22.4 points; 2017-18: 93 − 90 = 3 points
Primary completion: in 2011 and 2017-18 the female rate is higher than the male rate (94 > 92, 96 > 93)
Conclusion: the gender gap is narrowing, especially among the youth, a positive development in gender equity. Adult female literacy (66%) still lags well behind.
9 Future prospects
9.1 Education for All: still a distant dream
- Literacy rates for both adults and youth have increased
- Still, the absolute number of illiterates in India is as large as India’s population at the time of independence
- In 1950 the Directive Principles of the Constitution said the government should provide free and compulsory education for all children up to the age of 14 within 10 years
- Had this been achieved, India would have had cent per cent literacy by now
9.2 Gender equity: better than before
- The gap between male and female literacy is narrowing, a positive development in gender equity
- Still, women’s education needs to be promoted, for these reasons:
Economic independence
It improves women’s economic independence
Social status
It improves the social status of women
Fertility rate
Women’s education has a favourable impact on the fertility rate
Health care
It improves the health care of women and children
So we cannot be complacent about rising literacy rates; there are miles to go to reach cent per cent adult literacy.
9.3 Higher education: a few takers
- The Indian education pyramid is steep: fewer and fewer people reach the higher education level
- Also, unemployment is highest among educated youth
- These figures are from NSSO data for 2011-12
- The Periodic Labour Force Survey 2023-24 shows a moderate improvement
- The government should still increase allocation for higher education and raise the standard of institutions, so that students get employable skills
Writing “the more educated have less unemployment” goes against the book. Compared with the less educated, a large proportion of educated persons are unemployed (graduates 16-30%, primary-educated only 3-6%).
10 Conclusion
- The economic and social benefits of human capital formation and human development are well known
- The union and state governments earmark substantial outlays for education and health
- Education and health services should reach all sections of society so that economic growth and equity are attained together
- India has a rich stock of scientific and technical manpower
- The need of the hour is to improve it qualitatively and create conditions so that it is used in India
11 Exam-ready material
11.1 Key dates and terms
| Date / term | What to remember |
|---|---|
| 1950 | Directive Principles: free, compulsory education up to age 14 within 10 years |
| 1952 and 2020 | Education spending: 7.92% → 16.54% of total govt. expenditure; 0.64% → 4.47% of GDP |
| 1964-66 | Education Commission: at least 6% of GDP |
| 1999 | Tapas Majumdar Committee: ₹1.37 lakh crore over 10 years (1998-99 to 2006-07) |
| 2009 | Right to Education Act (ages 6-14) |
| 2011-12 | NSSO: educated youth unemployment (19%, 16%, nearly 30%) |
| 2020 | National Education Policy 2020 |
| 2020-21 | Sikkim ₹96,968 vs Bihar ₹10,710 |
| 2023-24 | Periodic Labour Force Survey: moderate improvement |
| 2% | Education cess on all Union taxes |
| Preventive medicine | Prevention such as vaccination |
| Convergence | Seen in measures of human capital, not in per capita real income |
11.2 Differences the exam asks (in brief)
| Difference | One-line answer |
|---|---|
| Human resource vs human capital | The resource is the raw form (students); capital is the skilled form after investment (doctors, engineers) |
| Physical capital vs human capital | Tangible, saleable, separable, private benefit only vs intangible, only services sold, inseparable, private and social benefits |
| Human capital vs human development | People as means, productivity the goal vs people as ends, well-being and rights the goal |
| Economic growth vs human development | Increase in real national income vs widening the ability to read, write and lead a healthy life |
| % of total govt. expenditure vs % of GDP | Importance of education to the government vs share of people’s income committed to education |
“6-14-6”
The Right to Education covers children aged 6-14; the Education Commission’s target is 6 per cent of GDP.
- Investment in education converts human beings into human capital; human capital is enhanced labour productivity acquired through deliberate investment
- Sources: education, health, on-the-job training, migration, information; the two major ones are education and health
- Physical capital is the base for the concept of human capital; human capital is intangible, inseparable, less mobile and gives social benefits
- Investment in human capital is considered efficient and growth enhancing; but evidence is nebulous and causality runs both ways
- Human development: education and health are integral to well-being, humans are ends in themselves; it is broader than human capital
- Government intervention: long-term impact, incomplete information, monopoly, poverty, rights
- Education spending as a share of total government expenditure shows its importance to the government
- Target 6% of GDP, current a little over 4%; 2% education cess; RTE Act 2009
- Achievement indicators: adult literacy, primary completion rate, youth literacy; the gender gap is narrowing
- Challenges: Education for All unfinished, women’s education, steep pyramid and educated unemployment
- Can I write all five sources of human capital with one example each?
- Can I write at least five differences between physical and human capital?
- Can I explain “human development is broader” using means and ends?
- Can I give the reasons for government intervention and both measures of education spending?
- Can I work out percentage-point changes from Tables 4.1 and 4.2 and write a conclusion?