
Covers T.R. Jain & V.K. Ohri (2026-27) ch 6. Based on NCERT Indian Economic Development, Chapter 6 (Reprint 2026-27) and the CBSE 2026-27 curriculum (Unit 7).
Board note: CBSE teaches this book in Class 12; UP, Bihar, Rajasthan and MP Boards teach it in Class 11.
- Say who a worker is, what an economic activity is and how the worker-population ratio is worked out
- Tell self-employed, regular salaried employees and casual wage labourers apart and classify any example
- Read the NCERT tables on rural-urban, men-women and sector-wise employment
- Explain jobless growth, casualisation and informalisation with the book’s data
- Identify open, disguised and seasonal unemployment, and explain direct and indirect employment generation by the government
1 Introduction: Why People Work
People do a variety of work: on farms, in factories, banks, shops and at home. Work at home is no longer only traditional work like weaving, lace making or handicrafts.
- Modern jobs such as programming work in the IT industry are also done from home
- Technology now lets people make factory-type goods at home in villages, like the footballs made in houses of Jalandhar, Punjab, which multinational companies sell
- During the Covid-19 pandemic in 2020-21, millions of workers delivered their products and services through work-from-home
Earning a living
People work to earn a living. Money got by inheritance, without working, does not fully satisfy anybody.
Self-worth
Work gives a sense of self-worth and lets us relate meaningfully with others.
Contribution to national income
Every working person contributes to national income and the development of the country through economic activities. This is the real meaning of earning a living.
Dependants
We also work to meet the needs of those who depend on us, which gives a sense of accomplishment.
What I object to, is the ‘craze’ for machinery, not machinery as such. The craze is for what they call labour-saving machinery. Men go on ‘saving labour’ till thousands are without work and thrown on the open streets to die of starvation…
Mahatma Gandhi (opening quotation of the chapter)
- Having recognised the importance of work, Mahatma Gandhi insisted on education and training through a variety of works, including craft
1.1 Why study working people
- It gives insight into the quality and nature of employment in a country
- It helps in understanding and planning our human resources
- It helps analyse the contribution of different industries and sectors to national income
- It helps address social issues such as exploitation of marginalised sections and child labour
2 Workers and Employment
When a farmer works on fields, food grains and raw materials for industries are produced. Cotton becomes cloth in textile mills and powerlooms. Lorries transport goods from place to place. Together these make up the country’s output.
Economic activities are those activities which contribute to the gross national product.
All those who are engaged in economic activities, in whatever capacity, high or low, are workers.
2.1 Who counts as a worker
✓ These are workers too
- Those who temporarily abstain from work due to illness, injury, physical disability, bad weather, festivals, social or religious functions
- Those who help the main workers in these activities
- The self-employed, who are not paid by any employer
✗ These are not workers
- Those not engaged in any economic activity, such as a beggar
- Those whose activity adds nothing to national output, such as a thief, smuggler or gambler
- A housewife, unless she also does some economic activity (under the present definition)
Do not think only paid employees are workers. Pavement vegetable vendors and professionals like lawyers, doctors and engineers, who are self-employed, are also workers.
2.2 India’s workforce: key figures
- The nature of employment in India is multifaceted
- Some get employment throughout the year; some get it for only a few months in a year
- Many workers do not get fair wages for their work
- While counting workers, all those engaged in economic activities are included as employed
- Since most people live in rural areas, the proportion of the workforce residing there is higher
- Men form the majority of the workforce; the remaining about 23% are women
2.3 Women whose work is unpaid
- Women cook, fetch water and fuelwood, and also do farm labour
- They are not paid wages in cash or in grains; at times they are not paid at all
- For this reason these women are not categorised as workers
- Economists argue that these women should also be called workers
- Some social scientists argue that housewives working at home without pay contribute to the gross national product and should be regarded as engaged in an economic activity
3 Participation of People in Employment
Worker-population ratio is an indicator used for analysing the employment situation in the country. It shows the proportion of the population that is actively contributing to the production of goods and services. It is found by dividing the total number of workers by the population and multiplying by 100.
- Higher ratio: greater engagement of people in work
- Medium or low ratio: a very high proportion of the population is not directly involved in economic activities
- The CBSE curriculum calls the same idea the “work force participation rate”
Given
A village has a population of 150, of whom 60 are engaged in economic activities.
To find
The village’s worker-population ratio
Formula: Worker-population ratio = (Workers ÷ Population) × 100
Substitution: = (60 ÷ 150) × 100
Answer: 40 (per cent)
Meaning: out of every 100 persons in the village, 40 are actively contributing to production.
3.1 Table 6.1: Worker-Population Ratio in India, 2023-24
| Sex | Total | Rural | Urban |
|---|---|---|---|
| Men | 56.4 | 56.3 | 56.4 |
| Women | 30.7 | 34.8 | 20.7 |
| Total | 43.7 | 45.6 | 38.9 |
- For every 100 persons in India, about 44 (43.7 rounded off) are workers
- The ratio is about 39 in urban areas and about 46 in rural areas
- Men’s ratio (56.4) is far higher than women’s (30.7)
- The gap is largest in urban areas: for every 100 urban women only about 21 are working, against about 35 in rural areas
3.2 Why the rural ratio is higher
Rural areas
- Limited resources to earn a higher income, so more people join the employment market
- Many do not go to schools, colleges or training institutions
- Even those who go often discontinue in the middle to join the workforce
- Their economic condition does not allow them to stay at home
Urban areas
- A considerable section is able to study in educational institutions
- A variety of employment opportunities is available
- People look for the appropriate job to suit their qualifications and skills
3.3 Why women, especially urban women, appear to work less
- Where men are able to earn high incomes, families discourage female members from taking up jobs
- Many household activities done by women are not recognised as productive work
- This narrow definition of work leads to non-recognition of women’s work
- The result is an underestimation of the number of women workers in the country
For “why are more rural women found working than urban women”, write both sides: poverty and less education push rural women into work, and higher family incomes keep urban women out of it. Add the figures (34.8 against 20.7).
4 Self-employed and Hired Workers
The worker-population ratio says nothing about workers’ status in society or their working conditions. The status with which a worker is placed in an enterprise shows one dimension of the quality of employment: the attachment a worker has with the job and the authority he or she has over the enterprise and co-workers.
Regular salaried employees and casual wage labourers both work for others, so together they are called hired workers. Percentages are for 2023-24 (Table 6.3: 58.4, 21.7, 19.9).
Workers who own and operate an enterprise to earn their livelihood are known as self-employed.
Casual wage labourers are workers who are casually engaged in others’ farms or work sites and, in return, get a remuneration for the work done.
When a worker is engaged by someone or an enterprise and paid his or her wages on a regular basis, the worker is a regular salaried employee.
| Basis | Self-employed | Regular salaried | Casual wage labourer |
|---|---|---|---|
| Ownership of enterprise | Own | Someone else’s | Someone else’s |
| Income | Earnings of own enterprise | Regular salary | Remuneration for work done |
| Continuity of work | In own hands | Regular, permanent | Uncertain |
| Security | Depends on the enterprise | Highest | Lowest (most vulnerable) |
| Examples | Owner of a saloon, handloom weaver | Cashier in State Bank of India, nurse with monthly salary for 5 years | Loading worker in a wholesale vegetable shop |
4.1 Chart 6.1: Distribution of Employment by Gender (%)
| Category | Male workers | Female workers |
|---|---|---|
| Self-employed | 54 | 67 |
| Regular salaried employees | 21 | 16 |
| Casual wage labourers | 25 | 17 |
| Total | 100 | 100 |
- Self-employment is a major source of livelihood for both men and women; it is above 50% for both
- Casual wage work is the second major source for women
- Men are engaged in regular salaried employment in greater proportion: men 21%, women 16%; the gap is very small
4.2 Chart 6.2: Distribution of Employment by Region (%)
| Category | Urban workers | Rural workers |
|---|---|---|
| Self-employed | 40 | 65 |
| Regular salaried employees | 48 | 13 |
| Casual wage labourers | 12 | 22 |
| Total | 100 | 100 |
Why rural areas have more self-employed
- Most of those depending on farming own plots of land
- They cultivate independently, so the share of self-employed is greater
Why urban areas have more regular salaried
- Everyone cannot run factories, shops and offices
- Enterprises in urban areas require workers on a regular basis
To classify a worker, check two things: (1) whose enterprise it is, (2) how the worker is paid. A typist engaged “on a daily wage basis but paid monthly” is casual, while a nurse “working regularly for 5 years with a monthly salary” is a regular salaried employee.
Economists point out that casual wage labourers are the most vulnerable of the three categories: their work is uncertain and they get no social security.
5 Employment in Firms, Factories and Offices
In the course of economic development, labour flows from agriculture to industry and services. This shift shows up in the distribution of workers by industry.
5.1 Eight industrial divisions and three sectors
| Sector | Industrial divisions |
|---|---|
| Primary sector | (i) Agriculture, (ii) Mining and Quarrying |
| Secondary sector | (iii) Manufacturing, (iv) Electricity, Gas and Water Supply, (v) Construction |
| Service (tertiary) sector | (vi) Trade, (vii) Transport and Storage, (viii) Services |
The secondary and tertiary (service) sectors together are called the non-farm sectors.
5.2 Table 6.2: Distribution of Workforce by Industry, 2023-24 (%)
| Industrial category | Rural | Urban | Male | Female | Total |
|---|---|---|---|---|---|
| Primary sector | 59.8 | 6.7 | 36.3 | 64.4 | 46.1 |
| Secondary sector | 21.4 | 32.4 | 28.8 | 15.6 | 24.1 |
| Tertiary/Service sector | 18.8 | 60.9 | 34.9 | 20.0 | 29.8 |
| Total | 100 | 100 | 100 | 100 | 100 |
- The primary sector (46%) is the main source of employment for the majority of workers in India
- The secondary sector employs about 24% and the service sector about 30% of the workforce
- About 60% of the rural workforce depends on agriculture, forestry and fishing
- About 21% of rural workers are in manufacturing, construction and other industrial activities, and about 19% in the service sector
- Agriculture is not a major source of employment in urban areas; about 61% of urban workers are in the service sector and about one-third in the secondary sector
- Both men and women are concentrated in the primary sector, but women much more: about 64% of the female workforce against 36% of males
- Men get opportunities in both the secondary and service sectors
6 Growth and Changing Structure of Employment
Nearly seventy years of planned development have aimed at expanding the economy through higher national output and employment. Here we look at two development indicators: growth of employment and growth of GDP.
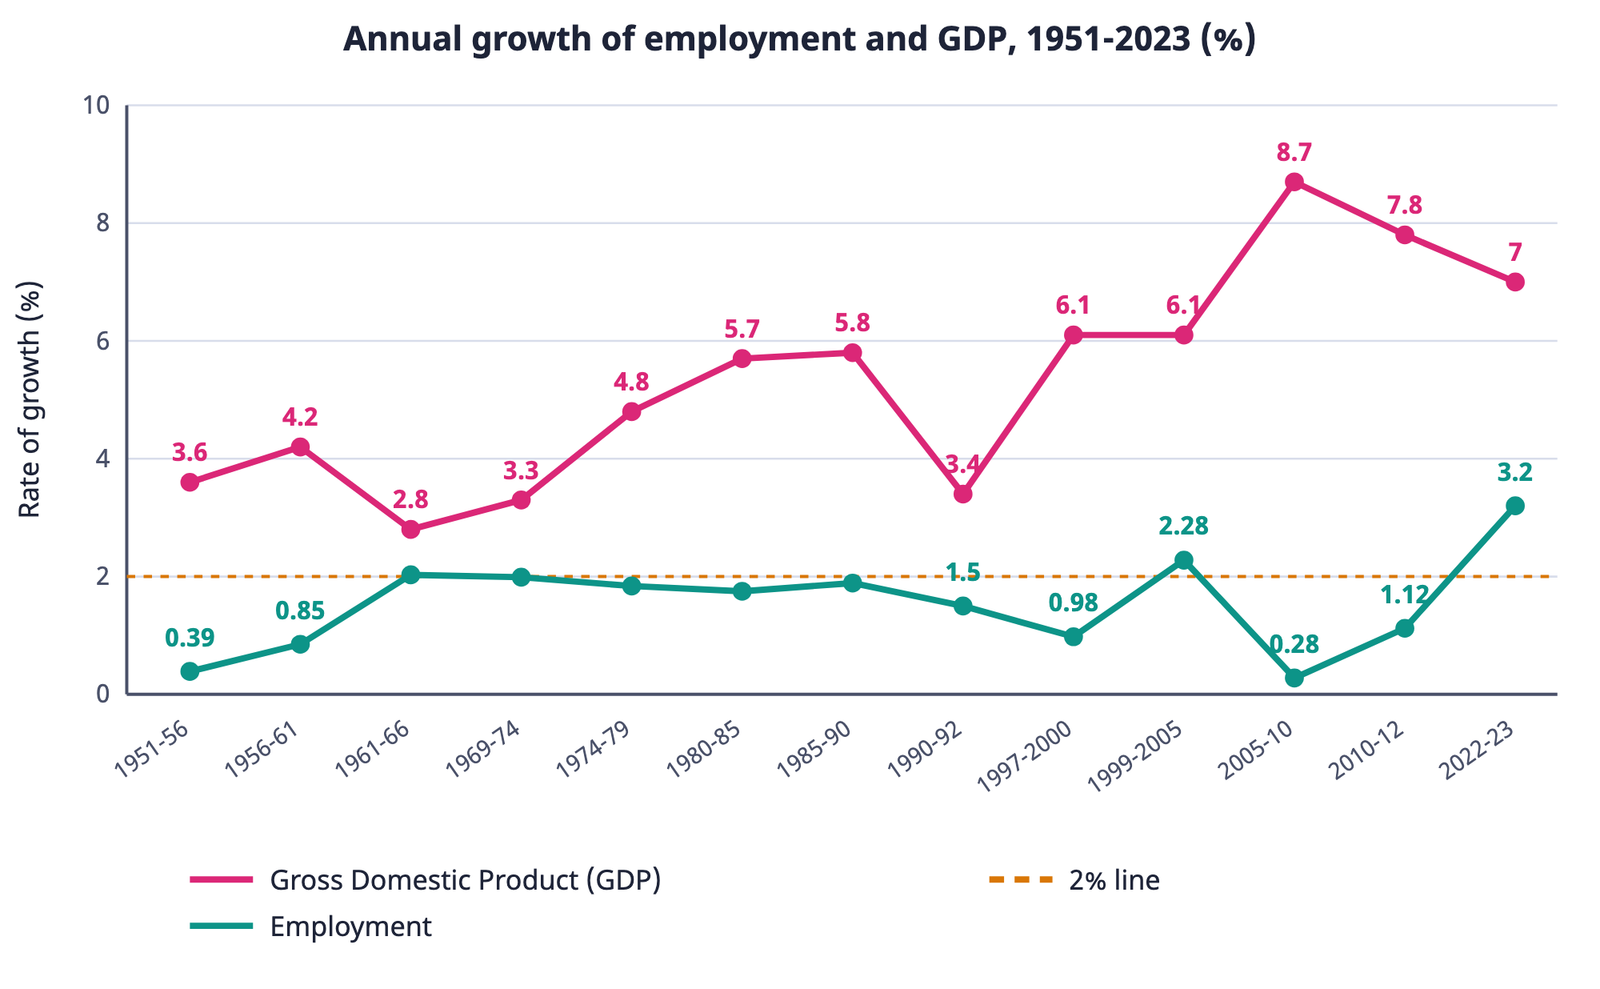
- During 1951-2023, GDP grew positively and its growth was higher than employment growth
- GDP growth fluctuated (for example 3.4% in 1990-92, 8.7% in 2005-10)
- Employment grew at a rate of not more than 2% most of the time
- Only in two periods, 1999-2005 (2.28%) and 2022-23 (3.2%), did employment growth go clearly beyond 2%
- In the late 1990s employment growth declined to the level of the early planning years (0.98% in 1997-2000)
- The gap between GDP growth and employment growth widened; in 2005-10 GDP grew at 8.7% but employment at only 0.28%
When the economy produces more goods and services without generating employment, scholars call the phenomenon jobless growth.
Jobless growth does not mean employment did not grow at all. It means employment grew much more slowly than output (GDP), so the gap between the two growth rates widened.
6.1 Sector-wise shift: from farm to non-farm work
India is an agrarian nation; a major section of the population lives in rural areas and depends on agriculture. Development strategies in many countries, including India, have aimed at reducing the proportion of people depending on agriculture.
Table 6.3: Trends in Employment Pattern (Sector-wise and Status-wise), in %
| Item | 1972-73 | 1993-94 | 2011-12 | 2017-18 | 2023-24 |
|---|---|---|---|---|---|
| Sector | |||||
| Primary | 74.3 | 64 | 48.9 | 46.1 | 46.1 |
| Secondary | 10.9 | 16 | 24.3 | 24.9 | 24.1 |
| Services | 14.8 | 20 | 26.8 | 29.0 | 29.8 |
| Status | |||||
| Self-employed | 61.4 | 54.6 | 52.0 | 55.6 | 58.4 |
| Regular Salaried Employees | 15.4 | 13.6 | 18.0 | 21.1 | 21.7 |
| Casual Wage Labourers | 23.2 | 31.8 | 30.0 | 23.3 | 19.9 |
Each year’s sector total and status total is 100. The book’s table also has a 1983 column; its status figures are self-employed 57.3, regular 13.8, casual 28.9.
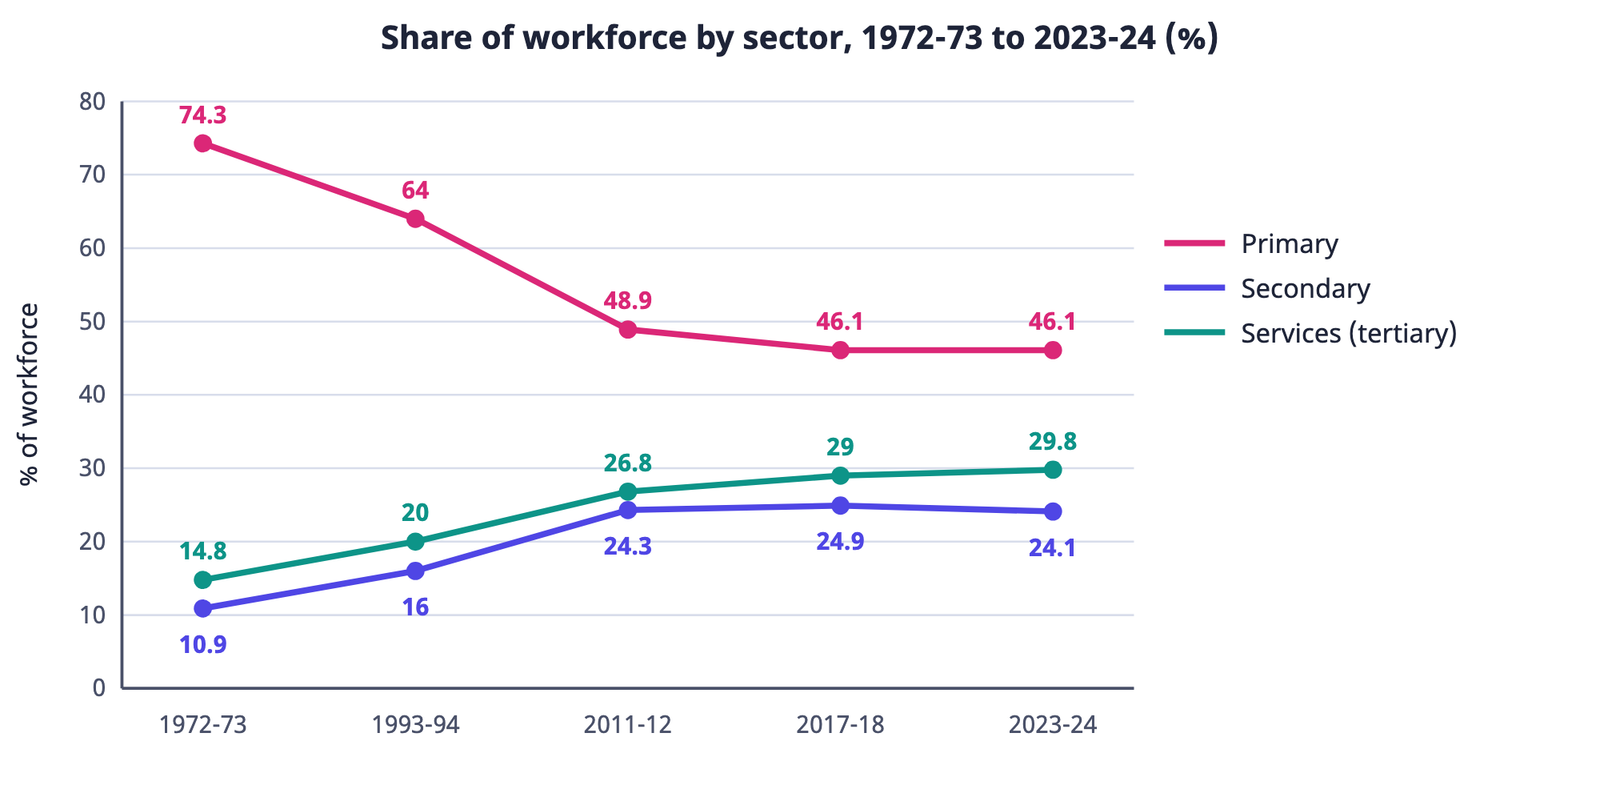
- In 1972-73 about 74% of the workforce was in the primary sector; by 2023-24 this fell to about 46%
- The share of the secondary sector rose from 11% to 24% and of the service sector from 15% to 30%
- So the secondary and service sectors show a promising future for the Indian workforce
- From 2011-12 to 2023-24 the secondary sector’s share stagnated around 24% (24.3, 24.9, 24.1)
6.2 Status-wise shift: casualisation

- The book says that over the last five decades people have moved from self-employment and regular salaried employment to casual wage work
- The table shows this most clearly between 1972-73 and 1993-94: casual rose from 23.2% to 31.8% while self-employed fell from 61.4% to 54.6% and regular from 15.4% to 13.6%
- Yet self-employment continues to be the major employment provider (58.4% in 2023-24)
- 2011-24 shows stagnation of the secondary sector and a moderate rise in self-employment (52.0 to 58.4)
- 2017-24 also shows a moderate rise in the share of regular salaried employees (21.1 to 21.7)
The process of moving from self-employment and regular salaried employment to casual wage work is called casualisation of the workforce. It makes workers highly vulnerable.
If casualisation raised a person’s earnings, would he be happy? A marginal farmer who becomes a full-time agricultural labourer, or a permanent pharmaceutical worker who becomes a daily wage labourer, loses security, continuity and social security even if earnings rise. The quality of employment is not measured by income alone.
7 Informalisation of Indian Workforce
Since Independence, one objective of development planning has been to provide decent livelihood to the people. It was envisaged that industrialisation would bring surplus workers from agriculture to industry with a better standard of living, as in developed countries. Yet after 70 years of planned development a large part of the workforce still depends on farming.
- Economists argue that the quality of employment has been deteriorating over the years
- Even after 10-20 years of work, many workers do not get maternity benefit, provident fund, gratuity and pension
- A person in the private sector gets a lower salary than another doing the same work in the public sector
- Only a small section of the workforce gets a regular income
- The government, through labour laws, enables this section to protect its rights; it forms trade unions and bargains with employers for better wages and social security
All public sector establishments and those private sector establishments which employ 10 hired workers or more are formal sector (organised sector) establishments, and those who work in them are formal sector workers.
All other enterprises and the workers working in them form the informal sector (unorganised sector).
Farmers and agricultural labourers
Millions of farmers and farm labourers
Small enterprises
Owners of small enterprises and people working in them
Self-employed alone
Self-employed who do not have any hired workers
Non-farm casual labourers
Those who work for more than one employer, such as construction workers and headload workers
All four groups above are in the informal sector. The book notes that this is one of the ways of classifying workers; there could be others.
| Basis | Formal (organised) sector | Informal (unorganised) sector |
|---|---|---|
| Who | All public sector establishments; private establishments with 10 or more hired workers | All other enterprises and workers |
| Income | Regular and higher | Irregular and lower |
| Social security | Available (provident fund, gratuity, pension) | Usually not available |
| Government protection | Labour laws, trade unions | No protection or regulation |
| Job security | Secure | Can be dismissed without compensation |
| Technology and accounts | Modern, accounts maintained | Outdated technology, no accounts |
Ask two questions: (1) Is the enterprise public (government)? Yes means formal. (2) If private, does it have 10 or more hired workers? Yes means formal; no means informal. An employee of a private firm with five hired workers is in the informal sector; a nurse in a government hospital is in the formal sector.
Count only hired workers. A hotel with seven hired workers and three family workers is informal, because its hired workers (7) are fewer than 10.
7.1 Box 6.1: Formal Sector Employment
- Information on formal sector employment is collected by the Union Ministry of Labour through employment exchanges across the country
- In 2012, of about 30 million formal sector workers, about 18 million were employed by the public sector
- So the government (public sector) is the major employer in the formal sector
- Men form the majority here too; women were only about one-sixth of the formal sector workforce
- Economists point out that the reform process begun in the early 1990s reduced the number of workers in the formal sector
7.2 Chart 6.4: Workers in Formal and Informal Sector (in millions)
Given
In 2019-20 there were 535 million workers, 59 million of them in the formal sector
To find
Percentage share of the formal and informal sectors
Formula: Formal share = (Formal workers ÷ Total workers) × 100
Substitution: = (59 ÷ 535) × 100 = 11.03
Answer: formal about 11%; informal = 100 − 11 = about 89%
Meaning: about 8 out of every 9 Indian workers are in the informal sector, where social security is almost absent.
- Planners expected that as the economy grows, more workers would become formal sector workers and the informal share would dwindle; the data show about 89% of workers are still informal
- In 2011-12 (the year for which gender-wise data are available) about 20% of formal sector and 30% of informal sector workers were women
7.3 Box 6.2: Informalisation in Ahmedabad
The box picture shows an unemployed mill worker peeling garlic at home while his wife has a new job of beedi rolling: a change in the balance of power in a house. Source: Renana Jhabvala, Ratna M. Sudarshan and Jeemol Unni (Ed.), 2003.
7.4 Attention to the informal sector and government steps
- Since the late 1970s many developing countries, including India, began paying attention to the informal sector because formal sector employment was not growing
- The sector’s features are in the table above: irregular income, no government protection, dismissal without compensation, outdated technology and no accounts
- Workers of this sector live in slums and are squatters
- Owing to the efforts of the International Labour Organisation (ILO), the Indian government has initiated modernisation of informal sector enterprises and social security measures for informal sector workers
Informalisation of the workforce is the process by which a growing share of workers ends up in the informal sector, without regular income or social security, instead of in secure formal sector jobs.
8 Unemployment
People look for jobs in many ways: through newspapers, friends and relatives, by standing at select places in cities waiting for a day’s work, by giving their bio-data at factories and offices, or by registering at employment exchanges. Many in rural areas do not go out and ask for a job but stay home when there is no work.
The National Statistical Office (previously the National Sample Survey Organisation) defines unemployment as a situation in which all those who, owing to lack of work, are not working but either seek work through employment exchanges, intermediaries, friends or relatives or by making applications to prospective employers, or express their willingness or availability for work under the prevailing condition of work and remunerations.
Economists define an unemployed person as one who is not able to get employment of even one hour in half a day.
8.1 Sources of data on unemployment
Census of India
Reports of the Census of India
National Statistical Office
Reports of Employment and Unemployment Situation and Annual Reports of the Periodic Labour Force Survey (PLFS)
Directorate General of Employment and Training
Data of registration with employment exchanges
These give different estimates of unemployment, but they tell us the attributes of the unemployed and the variety of unemployment in the country.
8.2 Types of unemployment
Open unemployment is the situation in which people willing to work look for jobs (through newspapers, friends, employment exchanges, applications) but find no work at all.
Disguised unemployment is the situation in which more people are engaged in a job than are actually needed; the extra people appear to be working but are not really needed. Economists call the unemployment prevailing on Indian farms disguised unemployment.
A farmer has four acres of land and actually needs only two workers and himself to carry out all the operations on his farm in a year. If he employs five workers and his family members such as his wife and children, this situation is disguised unemployment.
A study in the late 1950s showed about one-third of agricultural workers in India as disguisedly unemployed.
Work in agriculture is seasonal, so there is no work in the village in all months of the year. When there is no work on farms, people go to urban areas to look for jobs and come back as soon as the rainy season begins. This is seasonal unemployment, also a common form of unemployment in India.
| Basis | Open | Disguised | Seasonal |
|---|---|---|---|
| Visible? | Yes, the person has no work | No, the person appears to be working | Visible in some months of the year |
| Contribution | No work at all | Extra people are not needed and add nothing | No output in the slack months |
| Book’s example | People seek work through newspapers, friends, employment exchanges | Five workers plus family on a four-acre farm that needs two | Going to the city when farms are idle, returning in the rainy season |
Do not mix up disguised and seasonal unemployment. In disguised unemployment the person always appears to be at work but is not needed; in seasonal unemployment there is no work at all in some months.
- Scholars say people in India cannot remain completely unemployed for very long because their desperate economic condition does not allow it
- They are forced to accept jobs nobody else would do: unpleasant or even dangerous jobs in unclean or unhealthy surroundings
9 Government and Employment Generation
The Mahatma Gandhi National Rural Employment Guarantee Act 2005 (MGNREGA) promises 100 days of guaranteed wage employment to all rural households who volunteer to do unskilled manual work.
The scheme based on this Act is one of many measures to generate employment for those in need of jobs in rural areas. Since Independence, the Union and State governments have played an important role in generating employment. Their efforts fall into two categories: direct and indirect.
Direct employment generation
- The government employs people in various departments for administrative purposes
- It runs industries, hotels and transport companies and so provides employment directly
- Example: when a government-owned steel company raises output, employment in that company rises directly; dam construction work
Indirect employment generation
- When output of government enterprises rises, private enterprises that receive raw materials from them also raise output
- This increases employment opportunities in the private sector
- Example: private companies buying steel from the government steel company raise their output and employment
9.1 Employment generation programmes
- Many programmes aimed at alleviating poverty work through employment generation; they are also called employment generation programmes
- Besides employment, they provide services in areas such as:
For the 4-mark question “the government generates employment directly and indirectly”, write one paragraph for each, each with a definition and an example (appointment in a government department / a private firm buying from the government steel company).
10 Conclusion: The Changing Structure of the Workforce
- The structure of the workforce in India has changed; newly emerging jobs are found mostly in the service sector
- The expansion of the service sector and high technology now let efficient small enterprises and specialist workers survive side by side with multinationals
- For many, the home is becoming the workplace; the traditional notion of the modern factory or office has been altered
- This change has not gone in favour of the individual worker: employment has become more informal, with limited social security
- GDP grew rapidly in the last few decades without a matching rise in employment, which has forced the government to take initiatives to generate employment, particularly in rural areas
Outsourcing means that a big firm finds it profitable to close down some of its specialist departments (for example legal, computer programming or customer service sections) and hand over a large number of small piecemeal jobs to very small enterprises or specialist individuals, sometimes situated in other countries.
11 Key Dates and Terms
- In the worker-population ratio, divide by population, not by the workforce
- The formal-sector threshold is “10 or more hired workers”, not “more than 10”; a private establishment with exactly 10 hired workers is formal
- All public (government) establishments are formal whatever their size; but an employee kept on a temporary basis is not a regular salaried employee
- The largest source of employment in India is self-employment, not regular salaried work
- Even in 2023-24 the largest share of workers is in the primary sector (46.1%), not the service sector (29.8%)
- All persons engaged in economic activities and so contributing to gross national product are workers, including the self-employed
- Worker-population ratio = (Workers ÷ Population) × 100; India 43.7, rural 45.6, urban 38.9 (2023-24)
- About 44 of every 100 persons (43.7) are engaged in economic activities; rural men form the largest section of the workforce
- Most workers are self-employed (58.4%); casual (19.9%) and regular (21.7%) together are less than half
- Primary sector share fell from 74.3% (1972-73) to 46.1% (2023-24); secondary 24.1%, services 29.8%
- GDP grew faster than employment: jobless growth; employment growth mostly below 2%
- Moving from self-employment/regular jobs to casual work is casualisation; it makes workers vulnerable
- Formal = all public + private establishments with 10 or more hired workers; only 11% of workers were formal in 2019-20
- The government is the major formal sector employer
- Open, disguised (common in rural India) and seasonal unemployment
- The government generates employment directly and indirectly; MGNREGA 2005: 100 days
- New jobs are mostly in the service sector, but mostly informal and casual in nature
- Can I write the definitions of worker, worker-population ratio, jobless growth and casualisation without looking?
- Can I place any worker in the self-employed, regular or casual category, and in the formal or informal sector?
- Do I remember the key figures of Tables 6.2 and 6.3?
- Can I explain the three types of unemployment with examples?
- Can I explain direct and indirect employment generation with the steel company example?